Learn about the essential metrics of the Kubernetes platform, the best practices, and additional considerations when choosing Kubernetes monitoring tools.
🎉 Kubecost 2.0 is here! Learn more about the massive new feature additions and predictive learning

Kubernetes Monitoring Tools

Kubernetes is the industry-leading platform for container orchestration. It was initially designed and released as open-source by Google but is currently maintained by the Cloud Native Computing Foundation (CNCF). The ease of deploying applications on Kubernetes has led to its popularity in the container ecosystem. Adopters across all kinds of domains including e-commerce, financial services, retail, healthcare, media, travel, and advertising have all understood the positive impact of Kubernetes.

The management of Kubernetes clusters comes with its own unique set of challenges. Kubernetes eases management of a containerized infrastructure by creating levels of abstraction. However, these abstractions, combined with containerization technology, a distributed systems architecture, and the temporary nature of containers, increase the overall system complexity compared to traditional virtual machine-based workloads.

These complexities can be managed more easily via observability tools, which provide insight into system health, improving the usability of Kubernetes. They can help improve the availability of Kubernetes clusters by alerting cluster administrators when the system encounters problems. They can also provide valuable data to help cluster administrators troubleshoot issues promptly.

Monitoring Kubernetes clusters requires observation of various metrics of containers, nodes, services, and the clusters themselves. Kubernetes does not include a monitoring tool, but the de facto standard is Prometheus.

This article will introduce essential metrics to monitor in a Kubernetes cluster and show example metrics in Prometheus. We will also review several ideas to consider when deciding on a Kubernetes monitoring tool.
Selection criteria for Kubernetes monitoring tools

Consideration Description
Three pillars of observability The three pillars of observability are metric monitoring, data tracing, and log analysis.
Self-Hosted vs. SaaS-Based Products Monitoring tools fall into two broad categories: SaaS and self-managed. Examples of SaaS-based monitoring tools include New Relic, Datadog, Solarwinds, Dynatrace, and Kubecost. Examples of self-hosted monitoring tools include Prometheus, Kubernetes-Dashboard, metrics-server, Jaeger, and Sloop.
Essential metrics to monitor in a Kubernetes cluster The tool selected needs to have the ability to monitor several types of essential metrics, including application, cluster, and load balancer metrics.
Alerts and notifications A monitoring system should be able to send alerts when the system is near or in an error state.
Ease of management Several monitoring tools require extensive effort to install and configure, so ease of management is important.
Existing monitoring solutions Special consideration should be made for any existing monitoring systems.
Integrations into other tools The monitoring tools should integrate with other tools in use at the organization.
System availability Monitoring systems should be fault-tolerant.
Support It’s essential to consider the source of support for the system.

Three pillars of observability

Kubernetes is not an all-inclusive product, so users can integrate the monitoring solutions of their choice. The chosen tool should provide solutions for all three pillars of observability: metric monitoring, data tracing, and log analysis. All three observability pillars are essential for managing Kubernetes clusters and must be implemented for complete visibility into Kubernetes clusters.

Metric monitoring

Monitoring systems collect, measure, and visualize system performance data to generate insights about the health of systems. Thresholds and alerts notify engineering teams about potential issues with applications and the underlying infrastructure.

Data tracing

Data tracing systems show how multiple services connect and how data flows between them. This data helps engineering teams detect and track issues and solve problems at the root level.

Log analysis

Log analysis systems collect log data from across disparate systems into a single location, where they can be searched, analyzed, and visualized in real-time.

Self-Hosted vs. SaaS-Based Products

Monitoring tools fall into two broad categories: those based on software as a service (SaaS) and those that are self-managed. SaaS-based tools are managed by a vendor, whereas self-hosted tools require hands-on setup and maintenance.

SaaS-based monitoring tools

SaaS monitoring tools provide monitoring services without the need to manage the monitoring system infrastructure. With most SaaS services, the monitoring service is subscribed to and not purchased. The vendor is responsible for system reliability and guarantees the monitoring service via SLAs, freeing the system administrator from needing to deal with these issues.

The potential downside to SaaS is that most systems monitored by the service must be exposed to the SaaS service via the internet. This exposure can be a security compliance issue for backend servers that are not generally exposed to the internet.

SaaS-based monitoring tools include New Relic, Datadog, Solarwinds, Dynatrace, and Kubecost.

Self-hosted monitoring tools

These are traditional IT systems installed on the corporate intranet that are either purchased or open-source and managed by internal IT staff. The benefit of self-managed tools is that these products can be customized and configured to meet specific organizational needs. Most of these tools are open-source, so they have little or no licensing cost.

One of the drawbacks to self-hosted systems is that they often take extensive setup and configuration to be highly available (fault tolerant). It is essential that monitoring systems be highly available and deployed in a different data center from the one hosting the systems it is monitoring. Fault tolerance prevents the scenario where a data center outage causes the application infrastructure and the monitoring/alerting system to go down simultaneously.

Self-hosted monitoring tools include Prometheus, kubernetes-dashboard, metrics-server, Jaeger, and Sloop. In addition, a popular open-source desktop application for managing Kubernetes clusters is called Lens. Lens includes several Kubernetes observability features, such as increased visibility, real-time statistics, log streams, and hands-on troubleshooting capabilities.

Essential Metrics to Monitor in a Kubernetes cluster

The Kubernetes ecosystem is growing, and many tools and services are already available for it. However, the de facto standard monitoring system for Kubernetes is Prometheus. Several essential metrics that need to be tracked are listed below. We have also included Prometheus metric information and the corresponding Prometheus exporter that creates the metric data as an example.

Application Metrics

To ensure that the services are functioning correctly, you also need to keep an eye on a few key application metrics: application-specific metrics, error rates, and performance. Kubernetes keeps track of the current state of deployments, which is important for identifying unhealthy applications.

The following are categories of application-related metrics:

  • Application deployments:
    • The health status or current condition of a deployment
    • Metric: kube_deployment_status_condition
    • Prometheus Exporter: kube-state-metrics
  • Application performance:
    • How quickly the application responds to HTTP requests
    • Metric: probe_duration_seconds
    • Prometheus Exporter: blackbox-exporter
  • Application logs:
    • The rates of error or success messages in logs generated by the application
    • Metric: errors_total
    • Prometheus Exporter: grok-exporter
    • Application log messages are collected by a system other than Prometheus, such as ELK or Loki, for further analysis and anomaly detection.
  • Container resource utilization:
    • How much CPU and memory the containers are using
    • Metric: container_cpu_load_average_10s
    • Prometheus Exporter: cAdvisor
🎉 Kubecost Cloud is here! 🎉 Try our new multi-tenant SaaS Solution today!

Cluster metrics

The deployed workload can be monitored through the active nodes, pods, and containers; this will also reveal the resource capacity. CPU, memory, network I/O pressure and disk consumption are crucial cluster metrics that show whether the cluster is properly utilizing its resources.

Each Kubernetes node has finite resources that the running pods may use, so these metrics must be closely monitored:

  • Cluster health:
    • The rate of Kubernetes errors in the event logs
    • Metric: kube_event_count
    • Prometheus Exporter: kubernetes-event-exporter
  • Cluster node health:
    • The condition or health of the underlying cluster nodes
    • Metric: kube_node_status_condition
    • Prometheus Exporter: kube-state-metrics
  • Cluster resource utilization:
    • The proportion of available resources (CPU, memory, storage, etc) to current utilization
    • Metric: node_memory_MemFree_bytes
    • Prometheus Exporter: node-exporter

Load balancer metrics

Modern software systems are accessed via HTTP, with traffic routed through a load balancer. Load balancers are important to monitor because the traffic flow to the application endpoints can provide important health metrics of requests, errors, successful requests, and healthy/unhealthy endpoints.

The following are some important metrics to monitor:

  • Load balancer performance:
    • The current total of incoming and outgoing bytes
    • Metric: haproxy_server_bytes_in_total & haproxy_server_bytes_out_total
    • Prometheus Exporter: haproxy-exporter
  • Load balancer health:
    • The rate of HTTP errors processed by the load balancer
    • Metric: haproxy_server_check_failures_total
    • Prometheus Exporter: haprox-exporter
  • HTTP requests per second:
    • The current number of sessions per second over the last elapsed second
    • Metric: haproxy_server_current_session_rate
    • Prometheus Exporter: haproxy-exporter

Other important metrics

Monitoring tools are often extensible, especially open-source, self-managed tools. They can be used to monitor components that are not directly related to the application or the underlying cluster.

The following are less common metrics that can provide great value:

  • Job status:
    • Rate of failed and successful completion of Kubernetes jobs
    • Metric: kube_job_complete
    • Prometheus Exporter: kube-state-metrics
  • SSL lifetime:
    • SSL certificate expiration date or a number of days until expiration
    • Metric: probe_ssl_earliest_cert_expiry
    • Prometheus Exporter: Blackbox-exporter
  • Cost analysis prediction
    • An estimate of the predicted cost of running resources based on trend analysis
    • See the Cost Management section for advanced cost management features beyond this metric
    • Metric: node_total_hourly_cost
    • Prometheus Exporter: opencost-exporter
Learn how to manage K8s costs via the Kubecost APIs

Additional considerations

Alerts and notifications

A monitoring system should be capable of sending alerts when the system is approaching or currently in an error state. The tool selected needs to have the capability to set thresholds on metrics, so when the specified threshold is exceeded, the system sends an automated notification to the proper notification channel to be reviewed and acted upon.

Ease of management

Some tools require an extensive installation process; if this is a new tool, it may take time for the team to learn it. The tool should make it easy to add new metrics and modify existing metrics as new issues arise, or new monitoring needs are identified. The tool should also include dashboards for you to query, display, monitor, understand and share your data.

Existing monitoring solutions

If your organization already has a monitoring system for Kubernetes, it may be desirable to use it for this purpose. Using the existing system would enable your team to have a single tool (single pane of glass) to monitor all systems. Also, if your team is already familiar with the tool, they would not need time to learn a new tool.

Integrations with other tools

The monitoring tools should integrate with other tools in the organization. For example, alerts should be sent to the primary communication channel for the team, such as Slack, MS Teams, SMS, or email. Additionally, diverse resource utilization metrics provided by Prometheus can be used by tools like Kubecost in order to provide cost management and usage analysis.

Cost management

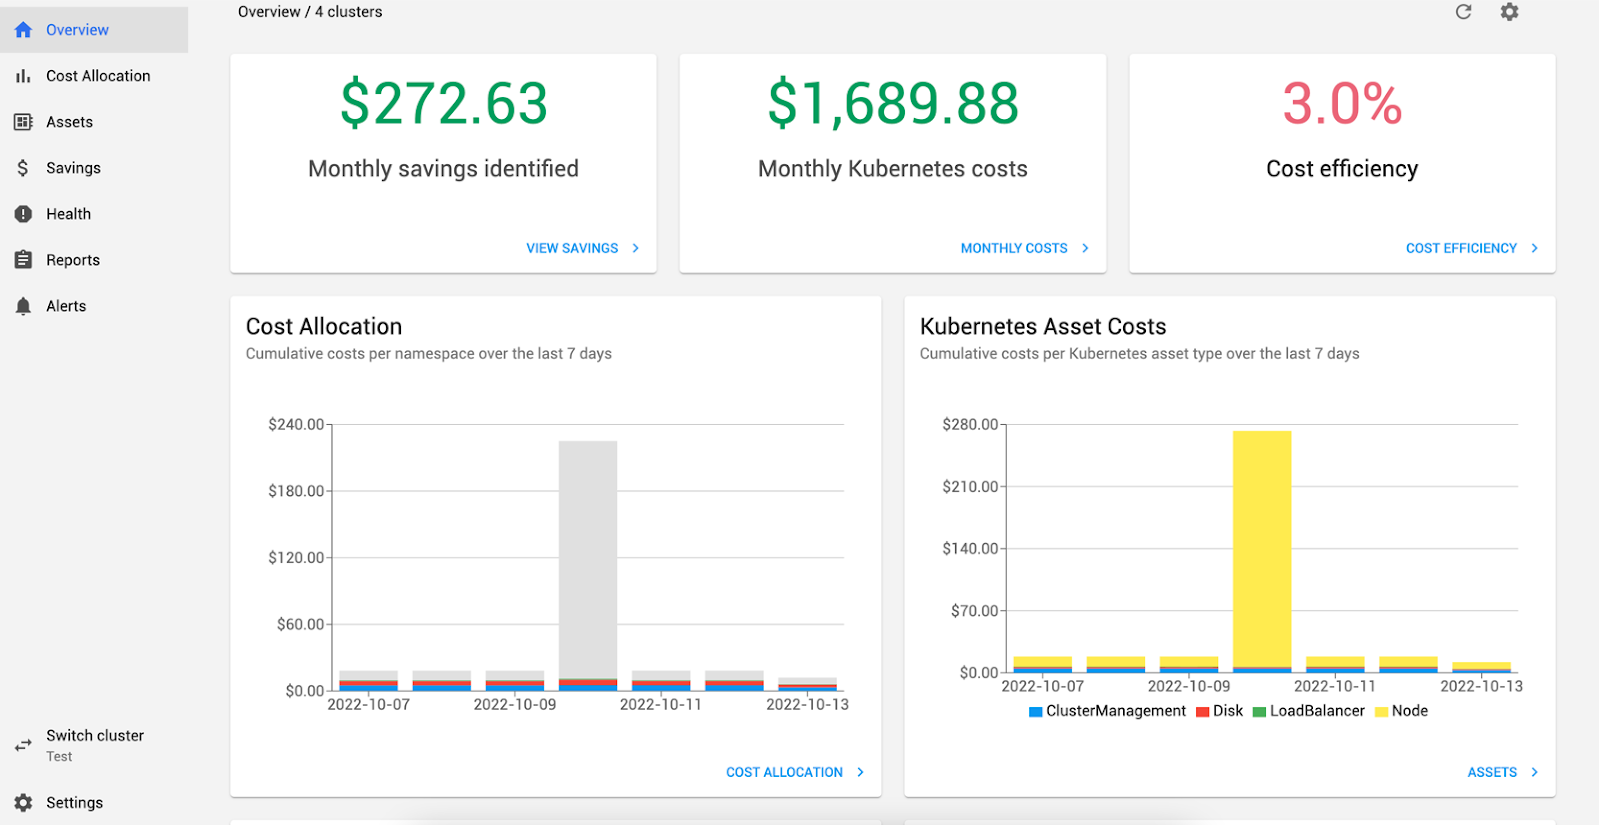
As discussed before, Prometheus is a rich data source with a diversity of metrics, some of which can be leveraged by tools such as Kubecost. Kubecost consumes utilization metrics (such as CPU, memory, GPU, storage, and network) and uses that data to provide insights into the efficiency, cost, and system health of Kubernetes clusters.

Kubecost main dashboard displays Kubernetes costs, efficiency, and health

Kubecost main dashboard displays Kubernetes costs, efficiency, and health

Kubecost can correlate the usage statistics with cost data gathered from the billing sources of public cloud providers (while also supporting on-premise implementations of Kubernetes). It can then segregate and allocate the costs across all Kubernetes resources such as namespaces, DaemonSets, pods, and even labels. The results are available in the form of dashboards and reports. The Kubecost alerts notify administrators of a sudden drop in efficiency or capacity headroom or detect a budget overrun.

You can download it here and use it free and forever on one cluster.

System availability

The monitoring system must have the ability to be deployed in a highly available (fault-tolerant) configuration in a separate data center than the one used by the systems it is monitoring. If there is a system outage and the monitoring system is also down, the monitoring system is useless.

Support

It’s essential to consider the source of support for the system. You might need to open a support ticket if the monitoring system was purchased from a vendor. You need to rely on the developer community if it's an open-source product.

Conclusion

Monitoring and observability tools provide insight into Kubernetes clusters. They help make the complexities of managing Kubernetes easier by providing a comprehensive view of the workloads and the underlying infrastructure.

Kubernetes does not include a monitoring system, so cluster administrators can choose the solution that works best for them.

Several technologies related to the use of Kubernetes must be monitored to create more resilient systems: the applications, the containers running the applications, the infrastructure supporting the containers, and Kubernetes itself.

Comprehensive Kubernetes cost monitoring & optimization

Continue reading this series