Now we have a better understanding of cAdvisor, let's look at some different implementation methods.
Implement cAdvisor as a container
This is the simplest method to get cAdvisor up and running. Here, users deploy the cAdvisor image and run it as an independent container in a Docker installation.
The cAdvisor container image is available via Google here, and anyone can pull the image to create a running cAdvisor container. Our example below uses Docker 20.10.14 in an Ubuntu 20.04.1 environment.
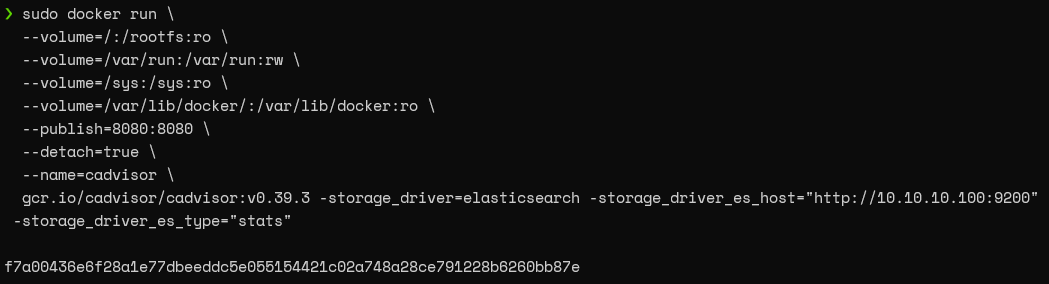
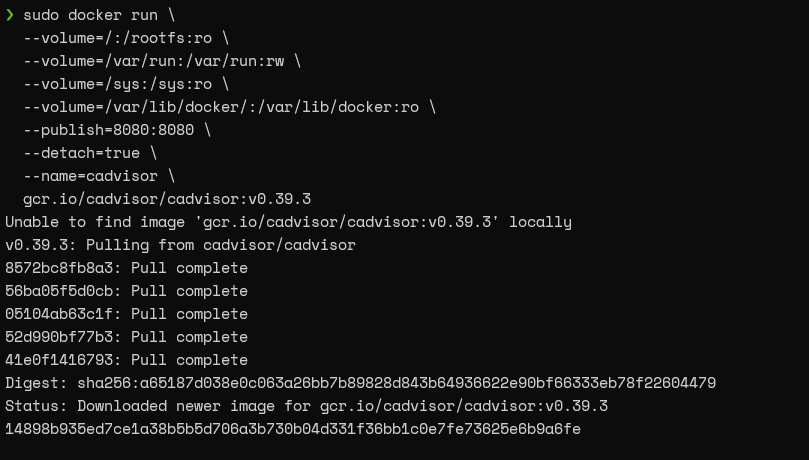
Run the following command to create a cAdvisor container in Docker:
sudo docker run \
  --volume=/:/rootfs:ro \
  --volume=/var/run:/var/run:rw \
  --volume=/sys:/sys:ro \
  --volume=/var/lib/docker/:/var/lib/docker:ro \
  --publish=8080:8080 \
  --detach=true \
  --name=cadvisor \
  gcr.io/cadvisor/cadvisor:v0.39.3
The result will look like this:
Note: Ensure that the correct cAdvisor version is referenced as the container image.
The cAdvisor container is now running and will begin collecting metrics. Users can access its web interface via port 8080.
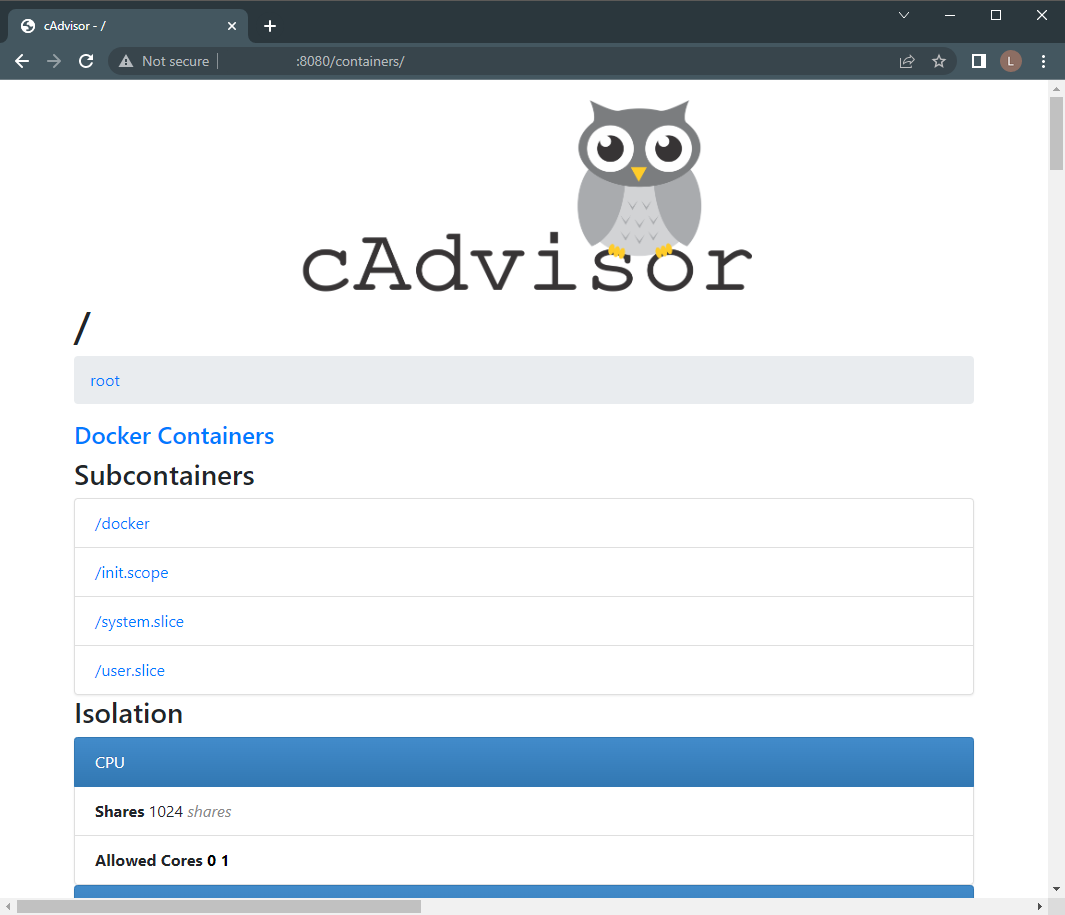
cAdvisor Web Interface home page
You can view individual containers and obtain individual metrics, by selecting the Docker Containers link.
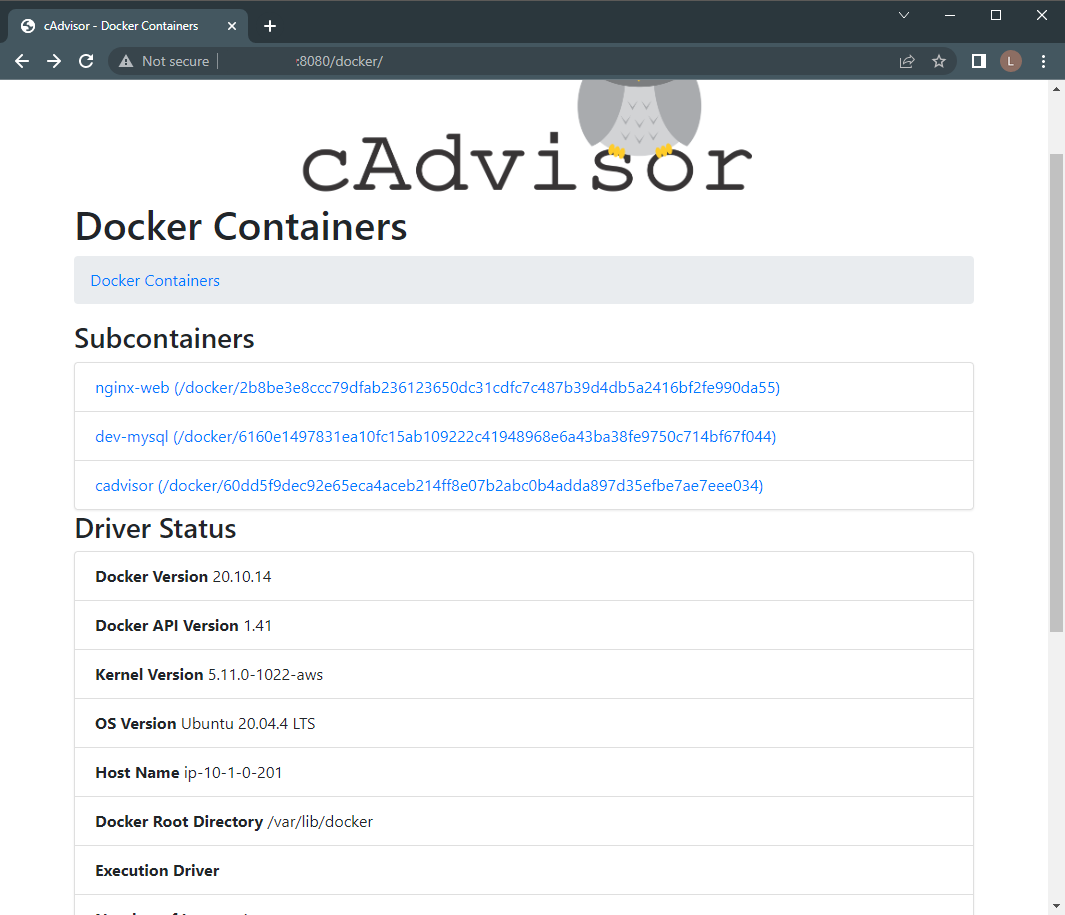
Docker Containers list
Implement cAdvisor as a standalone application
cAdvisor can also run directly in a host machine. Download the package from the GitHub release page here and run it on your host machine. No installation or configuration is required—it just requires the following commands:
wget https://github.com/google/cadvisor/releases/download/v0.39.3/cadvisor
chmod +x cadvisor
sudo ./cadvisor
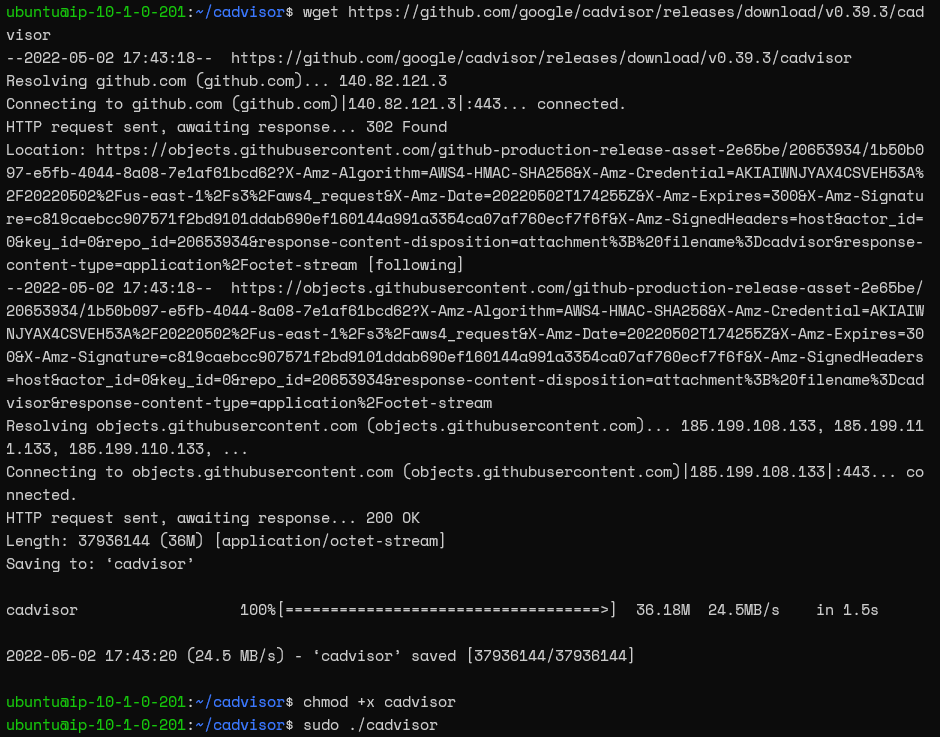
As before, users can access the cAdvisor interface via port 8080.
Note: in this case a cAdvisor container will not exist as it is running as a standalone application outside of Docker.
When running as a standalone application, cAdvisor will typically need root privileges. This is because accessing certain system data requires elevated permissions. Usefully, cAdvisor will gracefully degrade its features to match the available data sources that it’s allowed to access.
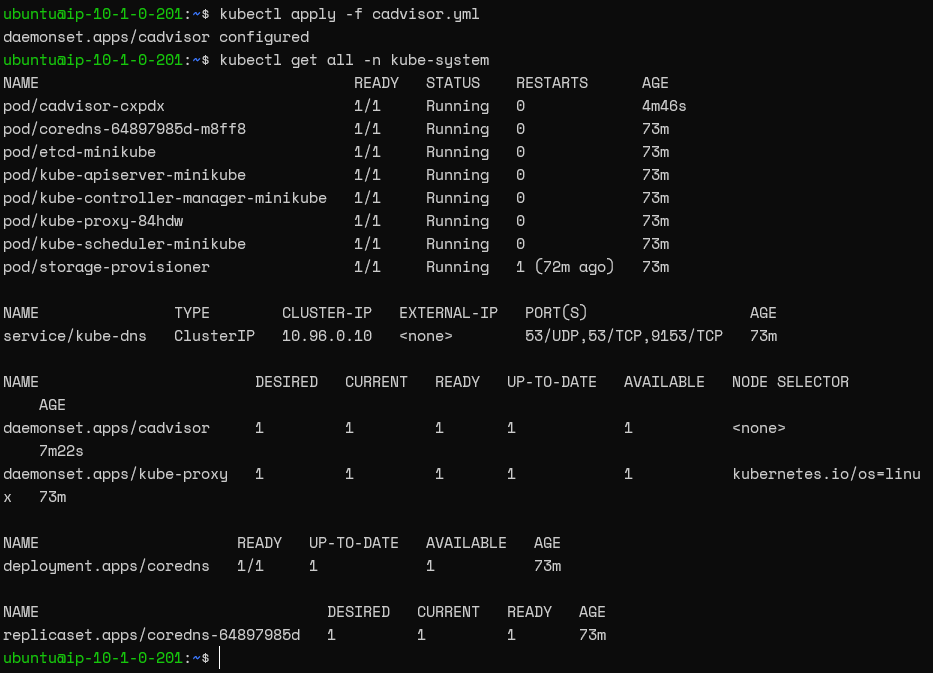
Implement cAdvisor in Kubernetes
cAdvisor can also be deployed in Kubernetes. A typical Kubernetes cluster consists of many nodes and cAdvisor should be installed on all of them to be able to export metrics from your containers successfully.
Manually installing cAdvisor into each cluster node is typically not feasible due to scale. Instead, make use of a Kubernetes DaemonSet, which will automatically deploy an instance of a given container to every node for you.
Installing cAdvisor as a DaemonSet
cAdvisor provides support for Kustomize. Kustomize allows users to easily customize and install cAdvisor as a DeamonSet in any Kubernetes cluster. Our example demonstrates this using a minkube 1.25.2 K8s cluster and Kustomize 4.5.4.
-
Download the Kustomize files from the git repository.
git clone https://github.com/google/cadvisor.git
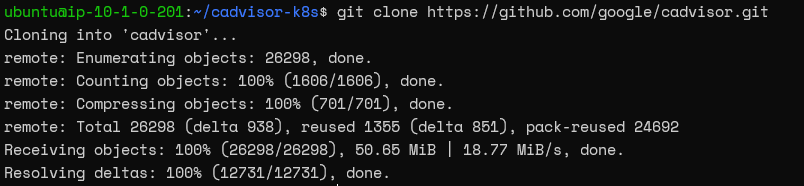
Cloning the cAdvior repository
-
Navigate to the deploy/kubernetes folder and change the configuration to reflect the desired cAdvisor version. This can be done using the following commands:
VERSION=v0.39.3
cd deploy/kubernetes/base && ./kustomize edit set image
gcr.io/cadvisor/cadvisor:${VERSION} && cd ../../..
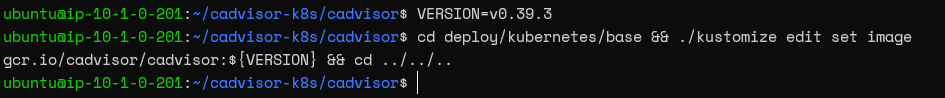
cAdvisor version
Note: Ensure you are pointing to the kustomize executable, located in your system.