Learn the best practices and instructions for using Kube-prometheus to deploy a full Prometheus stack including Prometheus, Alertmanager, Grafana, and a few exporters
🎉 Kubecost 2.0 is here! Learn more about the massive new feature additions and predictive learning

Kube-Prometheus: Tutorial & Instructions

Observability tools provide vital data on the health and state of Kubernetes clusters.This data helps Kubernetes administrators achieve many important objectives related to system performance, resource utilization, scaling, and root cause analysis.

Kubernetes does not include a built-in monitoring tool, but several tools can fill this gap with Prometheus—an open-source observability system developed at SoundCloud in 2012 and currently maintained by the CNCF—being the de-facto industry standard for monitoring Kubernetes clusters.

“Prometheus” typically refers to the Prometheus monitoring stack, which includes:

  • Prometheus for metric collection
  • Alertmanager for metric alerts and notification
  • Grafana for a graphical user interface
  • A set of exporters which function as metric collection agents

Each component is customizable and can be installed and configured using several different methods.

Kube-prometheus is a popular deployment method for the full Prometheus stack that can be easily deployed into a Kubernetes cluster. It includes a PrometheusOperator, Alertmanager, Grafana, and several Kubernetes-specific exporters. The stack is preconfigured to be highly available and collect metrics specific to Kubernetes clusters.

In this article, we will review the kube-prometheus monitoring stack for Kubernetes clusters, including a walk-through of exactly how to install Kube Prometheus yourself.

Executive summary: Kube-prometheus overview

Before we jump into detailed explanations, here’s an overview of what you should know about kube-prometheus at a high level.

Kube-prometheus Overview
Question Answer
What are typical kube-prometheus use cases? To provide insight into and monitor the state of a Kubernetes cluster and the deployments running in it
What is included with kube-prometheus?
  • Prometheus
  • Alertmanager
  • Grafana
  • Exporters:
    • node-exporter
    • kube-state-metrics
  • Prometheus Operator
How to install kube-prometheus? Kube-prometheus is a set of Jsonnet files executed to generate Kubernetes manifests for deployment into a Kubernetes cluster
How does kube-prometheus compare to the Prometheus Helm chart? Helm is a popular method of packaging Kubernetes stacks for distribution, and there are several versions of Prometheus available via Helm.

Comprehensive Kubernetes cost monitoring & optimization

What are typical kube-prometheus use cases?

Kubernetes is a complex system, and cluster administrators require observability tools to monitor the health and state of the systems. Kube-prometheus is ideal for several monitoring and observability use cases that we’ll review below.

System performance monitoring

Kube-prometheus can monitor system performance. Common examples of performance monitoring include application HTTP request response time and underlying infrastructure performance.

Prometheus can collect data on HTTP response times and show if the applications are responding quickly. The load balancerthroughput measures how many total requests are being processed. This data determines how many consumers are actively using the application and if they are getting a good experience.

Thresholds and alerts for this data will notify engineering teams about potential issues with slow applications.

Monitoring resource utilization

Kube-prometheus can monitor resource utilization. Resources are monitored to measure and compare to resource limits to predict if additional resources must be added to the cluster. A common use case is to alert cluster administrators when the system needs additional resources such as CPU, memory, and storage. In this use case, analyzing trends in resource utilization can guide how far systems need to be scaled up or out.

This is especially important with cloud-based infrastructure because it is paid based on usage. Cloud infrastructure administrators need this data to analyze trends and estimate the predicted cost of running these resources.

Thresholds and alerts notify engineering teams about potential utilization issues with the underlying infrastructure.

Post-incident cause analysis

Observability systems show how multiple services connect, how data flows between them, and anomalies in this data. This data can be used during and after incidents to track issues and perform root-cause analysis. It also helps infrastructure teams prevent issues from reoccurring.

What is included with kube-prometheus?

Kube-prometheus is a deployment method for the full Prometheus stack that administrators can easily deploy into a Kubernetes cluster. It contains several components:

  • Prometheus for metric collection
  • Alertmanager for metric alerts and notification
  • Grafana for a graphical user interface
  • A set of Kubernetes-specific exporters which function as metric collection agents
A diagram of the Prometheus architecture

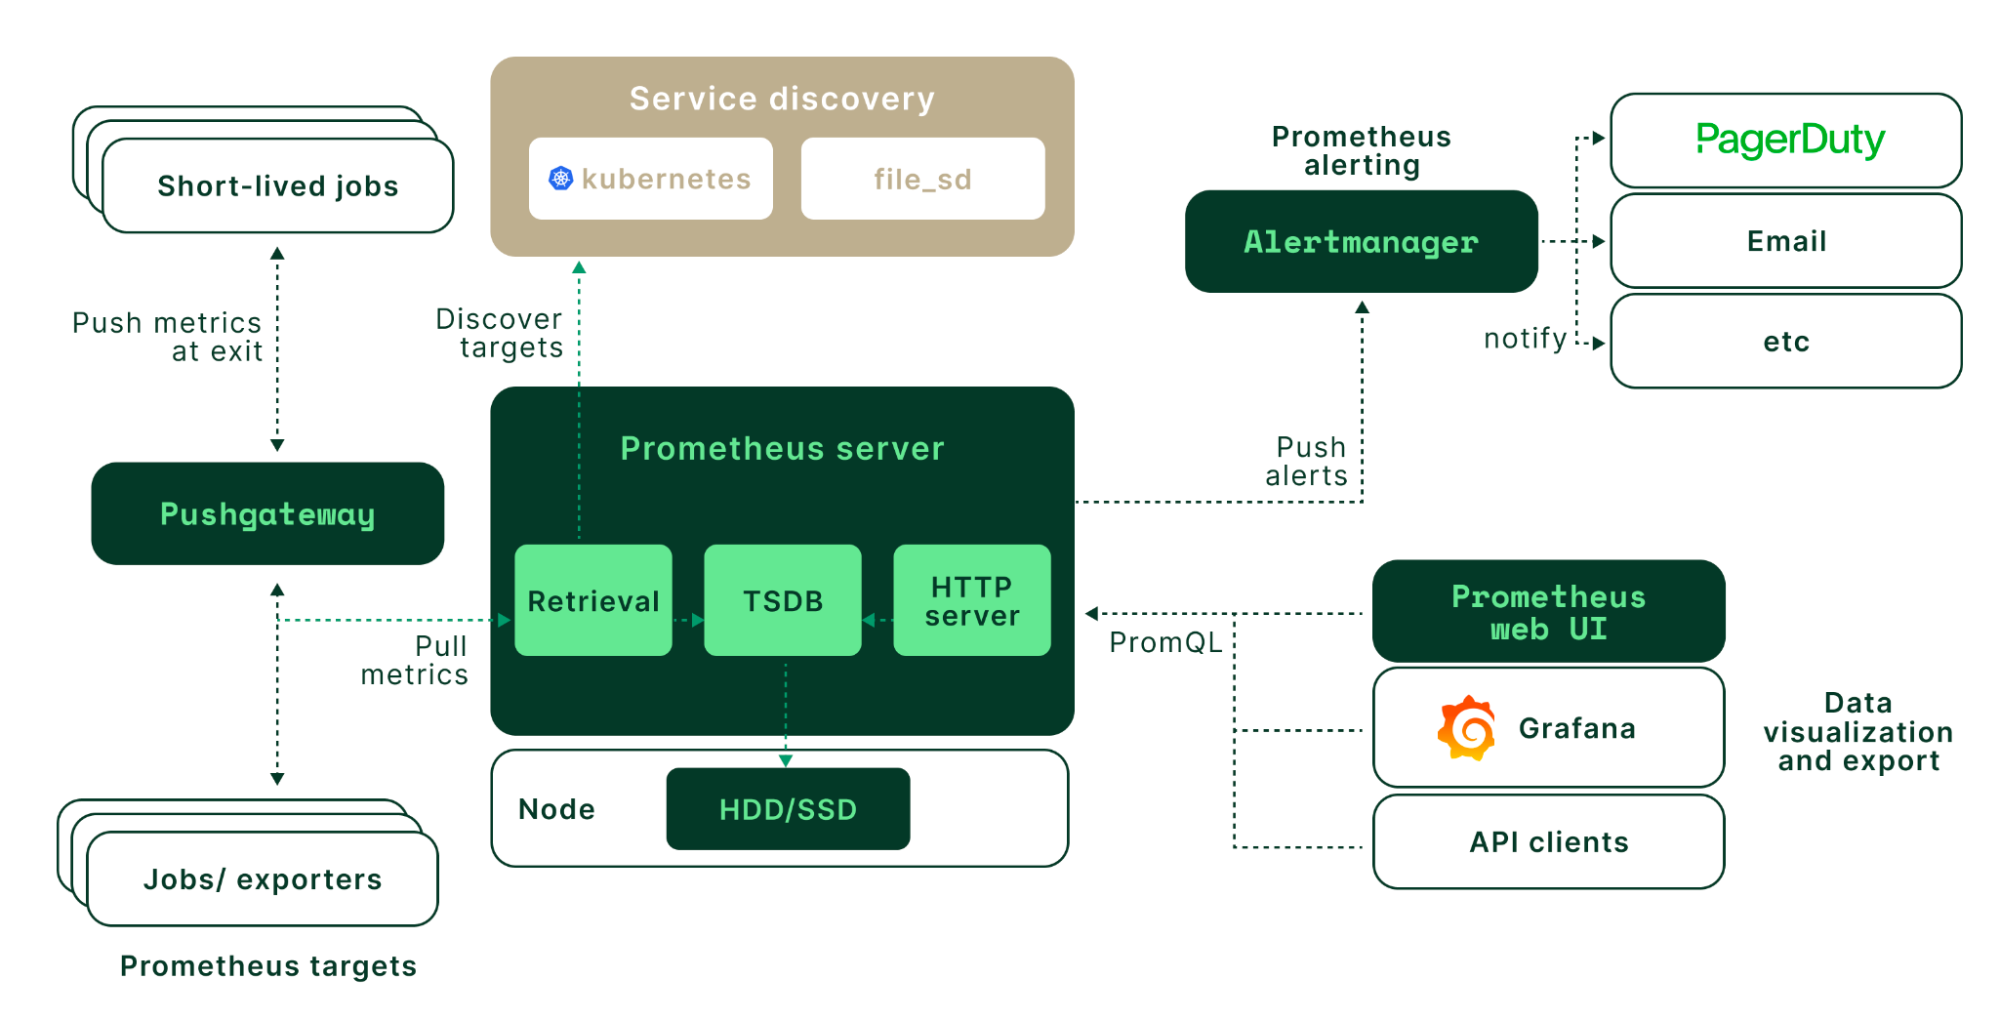
A diagram of the Prometheus architecture. (Source)

Prometheus

Prometheus is the core component of the kube-prometheus stack. It is the metric collection engine that collects metrics from agents and stores them in its internal time series database. In Prometheus, the collection process is called scraping, and the collection agents are known as exporters.

Prometheus uses a pull method of metric collection. Exporters expose their underlying metrics via an HTTP endpoint, and Prometheus scrapes these endpoints for measured data at a configured interval. The default scrape frequency for Kubernetes metrics is 30 seconds.

The Prometheus database has a multi-dimensional data model with time series data identified by metric name and key/value pairs. This database is queried using PromQL, a flexible query language to leverage this dimensionality.

In kube-prometheus, Prometheus is deployed as a highly available component with two replicas by default.

Kubernetes Exporters

There are hundreds of Prometheus exporters available. Additionally, there are several libraries for creating your own exporter. Kube-prometheus comes with several exporters for providing metric data pertinent to Kubernetes, including kube-state-metrics (KSM) and node-exporter.

Kube-state-metrics (KSM)

KSM is a deployment of the image quay.io/coreos/kube-state-metrics. This exporter exports metrics directly from the Kubernetes API server. It generates metrics about the internal Kubernetes objects, such as deployments, services, nodes, and pods.

Example metrics provided by kube-state-metrics include:

  • kube_deployment_status_condition: condition and health status of a deployment
  • kube_node_status_condition: condition or health of the underlying cluster nodes
  • kube_pod_info: information about Pods such as namespace, IP address, and node

A reference of all metrics provided by kube-state-metrics exporter can be found here.

Node-exporter

Node-exporter is a daemonset of the image quay.io/prometheus/node-exporter. This exporter exports metrics from the underlying cluster nodes. It generates metrics related to server resources, such as load average, CPU, memory, and storage performance.

Example metrics provided by node-exporter include:

  • node_load1: 1-minute average load and is read from the hosts /proc/loadavg file
  • node_cpu_seconds_total: how many seconds each CPU spent performing work. The data is populated from the host file /proc/stat
  • node_memory_MemAvailable_bytes: the amount of available memory, including caches and buffers that can be opened. The data is populated from the host file /proc/meminfo
  • node_disk_io_now: the current disk input and output operations performed. It is read from the hosts /proc/diskstats file.

A reference of all collectors that generate metrics provided by node-exporter can be found here.

K8s clusters handling 10B daily API calls use Kubecost

Alertmanager

Alertmanger manages alerts for metrics that exceed preconfiguredthresholds. Kube-prometheus has a prebuilt set of alerts specific to Kubernetes.

Alertmanager is responsible for sending the alert notification to a communication receiver when the metric reaches the alarm state. It also sends a notification when the alert is resolved. Standard notification receiver integrations include email, Slack, PagerDuty, and SMS.

Additionally, Alertmanager can send an HTTP request to a custom HTTP endpoint. It also has a feature for grouping similar alerts and muting, which helps manage communication during ongoing outages.

Grafana

Grafana enables visualization with a set of prebuilt Kubernetes dashboards. These dashboards enable cluster administrators to query, visualize, and understand Kubernetes data stored in Prometheus.

A Kubernetes Dashboard in Grafana displays resource metrics

A Kubernetes Dashboard in Grafana displays resource metrics.

Prometheus Operator

Kube-prometheus uses the Prometheus Operator to simplify and automate the setup of this stack. The Prometheus Operator uses Kubernetes Custom Resource Definitions (CRDs) to create this stack as a native Kubernetes manifest. This custom Prometheus resource can be seen in the manifests generated by kube-prometheus.

How to install kube-prometheus

Before installing kube-prometheus to your Kubernetes cluster, confirm that the release version you installed is verified to work with your Kubernetes version. Here is a compatibility chart for reference.

A kube-prometheus compatibility chart details compatible versions

A kube-prometheus compatibility chart details compatible versions. (Source)

The installation of kube-prometheus consists of three general steps:

  1. Configure the jsonnnet file
  2. Run the build script
  3. Apply the Kubernetes manifest to your cluster.

Configure the Jsonnetconfig file

If this is your first time using Jsonnet, you will need to install it via homebrew or pip:

$ brew install jsonnet

or

$ pip install jsonnet

Next, clone the kube-prometheus repository from GitHub:

$ git clone https://github.com/prometheus-operator/kube-prometheus

Rename and edit example.jsonnetin the project root using your preferred editor. This will be where you can enable or disable features, change the namespace name from the default “monitoring” setting, or enable ingress.

Run the build script

Run the build script, passing the name of your Jsonnet file as the only argument. This script will generate all the Kubernetes manifest files for the Kube-prometheus stack:

$ ./build.sh example.jsonnet

Apply the Kubernetes manifest

The final step is to apply the Kubernetes manifests generated by the build script. Complete this application in two steps: first, create the namespace and custom resources in the setup subdirectory, and then create the Prometheus resources.


$ kubectl apply -f manifests/setup
$ kubectl apply -f manifests/

To delete kube-prometheus from your cluster, run the following command:

$ kubectl delete --ignore-not-found=true-f manifests/ -f manifests/setup

Comparison to Prometheus Helm Chart

If you prefer managing your cluster objects using Helm, a community-supported Helm chart is available for the Prometheus stack for use in Kubernetes. The kube-prometheus-stackchart can be found in the prometheus-community Helm repo, and it provides a similar feature set to kube-prometheus.

Learn how to manage K8s costs via the Kubecost APIs

Additional kube-prometheus recommendations

Now that you know how to install kube-prometheus, here are two additional recommendations for working with it.

Account for persistent storage requirements

The stack is intended to be ephemeral and will not retain its state across restarts. If you plan to retain metrics from a prior restart or customize the Prometheus components, such as alerts and dashboards, you must manage the state of these changes. For example, changing the deployment to a stateful set or mounting a persistent volume.

Use federation for multiple clusters

It's common to manage multiple Kubernetes clusters and monitor all clusters from a single Prometheus instance using federation. In this case, you would create a Prometheus instance as the controller instance and configure it to collect metrics from the other source instances (running kube-prometheus) via their /federateendpoint.

The source instances only need to run Prometheus and the exporters, and Grafana and Alertmanager can be disabled. Grafana and Alertmanager would only be used in the controller instance. Administrators can configure alerts and dashboards to target a single or all clusters.

Conclusion

Kube-prometheus is a preconfigured Prometheus stack to collect metrics from Kubernetes clusters to provide end-to-end cluster monitoring. It generates the Kubernetes manifests for Prometheus, several metric exporters, Grafana dashboards, and predefined Kubernetes-specific alert rules to simplify the setup while providing customization options.

Comprehensive Kubernetes cost monitoring & optimization

Continue reading this series