Description: Learn about the role of Envoy at the core of Istio and follow step by step instructions to configure them in your environment.
🎉 Kubecost 2.0 is here! Learn more about the massive new feature additions and predictive learning

Istio & Envoy: How they work together

The idea of load balancing and proxies has been around for a while. In fact, the technology dates back to the 1990s, when hardware-based devices distributed the network traffic to back-end servers. As the world of technology evolved, however, so did the load balancer and the proxy, migrating eventually to software-based platforms.

Software-based load balancers, such as Kubernetes Ingress and NGINX, are now ubiquitous. Beyond that, however, there exists a whole new world of microservices and distributed architectures that bring unique and interesting challenges.

New players like Envoy and Istio have emerged to address many of these challenges, providing new ways to manipulate and secure traffic patterns.

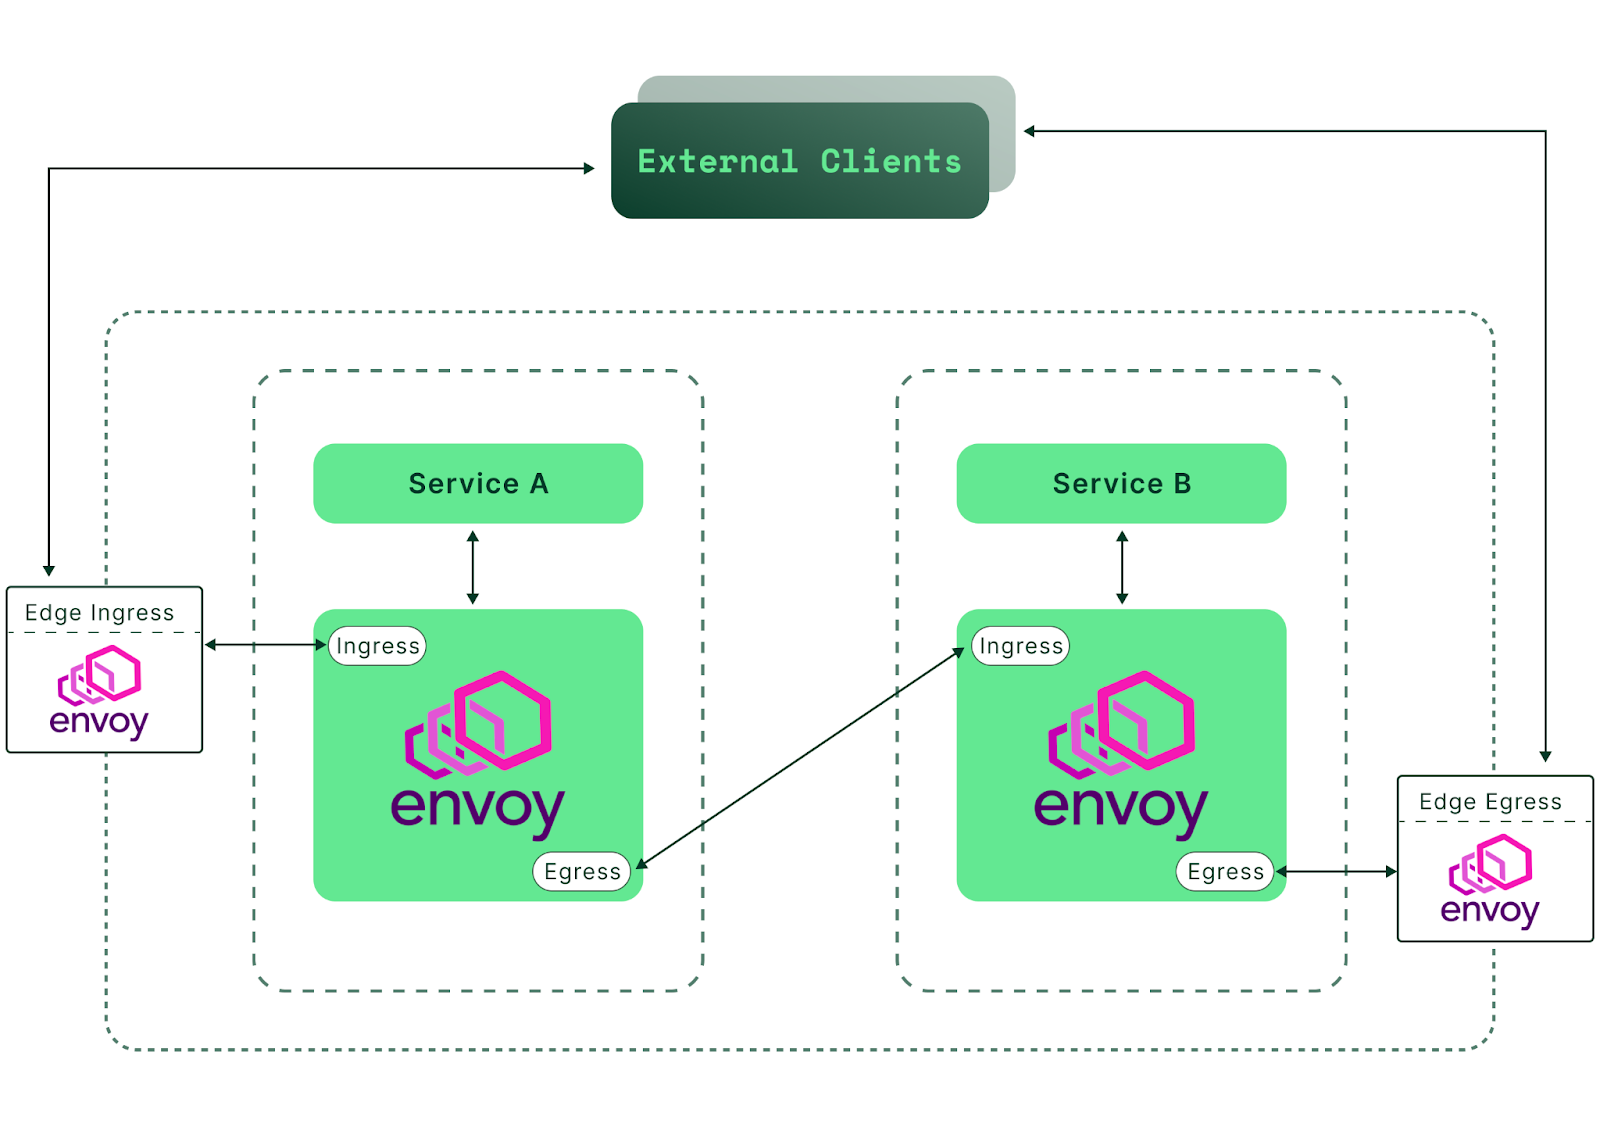
Let’s start with Envoy. What is it, and how does it fit into today's architecture? To quote their official site, “Envoy is an L7 proxy and communication bus designed for large modern service-oriented architectures.” It can also act as an L3/L4 proxy, an advanced load balancer, an edge proxy, and much more—as we will soon see.

Envoy was created in 2016 by Lyft and has had 72 major releases since then. It’s open-source, a CNCF graduate, popular, capable, and very well-maintained.

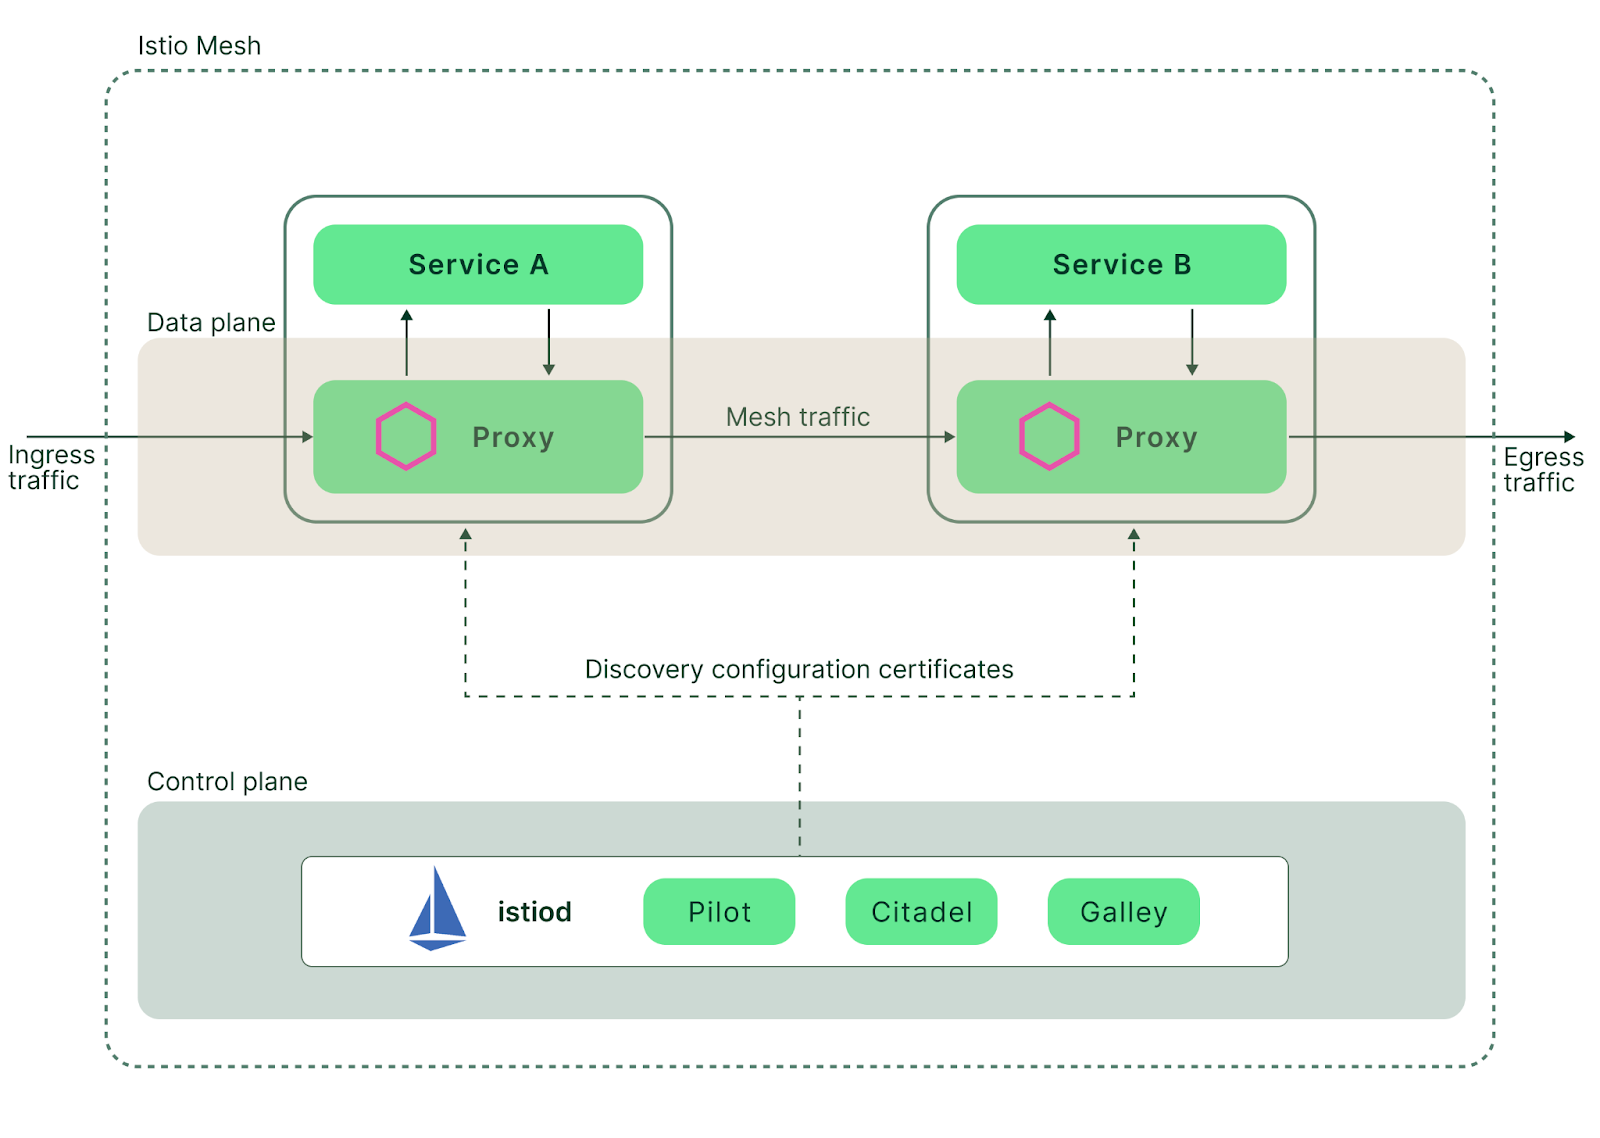
Next, we’ll introduce Istio. Istio was created in 2017 as a collaboration between IBM, Google, and Lyft. It Implements a whole new approach to communication between distributed applications. Istio is an example of what’s known as a “service mesh.'—that is to say, a dedicated infrastructure layer that runs alongside applications, interconnecting them. Service meshes give us greater control of network communications because they provide observability, traceability, and security. Furthermore, they do so without requiring that these communication-enhancing features are explicitly built into the applications themselves..In this article, we’ll look at Envoy as a core building block for Istio service mesh. Along the way, we’ll assess the features it brings to Istio, and highlight some drawbacks.

Envoy: concepts and features

Before we plunge into a discussion of Envoy’s role in Istio Service Mesh, let’s cover some basic Envoy concepts and terminology:

  • host: a logical entity that participates in network communication
  • downstream: a process or an application that communicates with an Envoy proxy
  • upstream: a destination host to which Envoy establishes communication
  • mesh: an assembly of hosts that have logical groupings and provide a consistent networking space
  • runtime configuration: a dynamic configuration deployed to every participating Envoy proxy within a mesh that contains details about traffic processing rules, Envoy runtime configuration, enabled features, and other attributes
  • ingress and egress: logical network objects that intercept and process traffic heading towards (ingress) and from (egress) your applications

Understanding these definitions is essential to grasping the life of a network packet as it passes through a proxy. All of these definitions are also equally applicable to Istio.

Now, let’s take a look at a diagram (inspired by an original document from Envoy) that will give us a practical example of how these pieces work together.

Envoy mesh topology

The life of a request inside an Envoy mesh topology

Here we see an advanced use case, with Envoy acting as both the edge proxy (with possible TLS termination, AAA, request limiting, etc) and as a mesh for internal communication. This is what happens when an external source connects to a service:

  • any external requests heading into a cluster first land on the edge proxies
  • the edge proxy forwards these requests to the respective service, based on discovery and predefined routing rules
  • the service receives it via an ingress listener and processes the request
  • responses are sent via an egress listener (either edge or service-related)
  • if more internal communication occurs between services (e.g. frontend to backend) then the pattern repeats itself

It is important to note that the same topology would also be applicable to Istio service mesh, since Istio is using Envoy at its core (albeit an extended version).

Comprehensive Kubernetes cost monitoring & optimization

Istio data plane: Envoy’s playing field

In our example “life of a request” above, we looked a little closer at how Envoy Proxies interact with different types of requests. We also mentioned that Istio uses Envoy at its core. Let’s expand on this and see exactly how it's being used inside the Istio service mesh.

Istio has two logically separate planes that together form a mesh:

  • the data plane: built on top of Envoy, it’s solely responsible for all data passing through the mesh
  • the control plane: implemented monolithically, it’s responsible for tasks such as mesh configuration (including Envoy’s runtime configuration, traffic routing rules, etc), populating the service catalog by connecting to the respective service discovery mechanism, providing certificate management, and setting up secure communications

Now, to further understand Envoy’s placement in the data plane, let’s take a look at an architecture diagram from Istio’s official documentation. For simplicity, it uses only a single control deployment model.

Istio architecture

Istio architecture (source)

Envoy is deployed into a Kubernetes cluster using a sidecar pattern, which means that every Istio-enabled application (or namespace, deployment, or pod) gets injected with a container running an Envoy proxy, with the necessary configuration bootstrapped into it. This process is overseen by the control plane (and its Pilot component) and abstracts Envoy’s configuration into a more high-level Istio concept. Usage of the sidecar pattern also eliminates the need to re-architect any existing infrastructure and provides a flexible way of rolling out the service mesh gradually.

Envoy provides many useful features for Istio, which can be grouped into the following rough categories:

  • traffic control and network resiliency: load balancing, traffic throttling, rate limiting, fault injection, failover, and retry mechanisms
  • security and authentication: the policy-enforcement point for authentication policies that define the rules of request and peer authentication
  • observability: rich telemetry data for mesh communications, including metrics, traces, and access/audit logging
  • extensibility: enables additional Envoy filters, WASM plugins, and allows Istio to be integrated into almost any environment

To be thorough, let’s take a closer look at these categories and explore how Envoy enables each functionality for Istio.

Traffic control and network resiliency with Envoy

As discussed, Istio is built on top of an extended version of Envoy and provides many abstractions to simplify the configuration of a proxy. These abstractions are translated from Istio CRDs via Istio’s control plane component, called Pilot, and into xDS API calls to Envoy.

When talking about broad groups such as “traffic control” or “network resiliency,” there are almost too many areas to cover. For the sake of brevity, we’ll focus on one of the more common examples.

Imagine that you have a set of services inside a service mesh: an entrypoint publicly exposed behind a DNS name and services communicating via REST. We want to ensure that our services not only do not get fatigued (by balancing the load), but also that we quickly cut connections to any services that may be unresponsive.

In terms of Istio abstractions, the following resources would be used to set up our example:

To demonstrate this more practically, we will now look at a Kubernetes manifest that describes the gateway deployment along with a “life of a request” diagram.

The manifest below does the following:

  • exposes demo-svc as demo.example.com via (ingress) Gateway on port 443(HTTPS)
  • matches two routes (set in VirtualService), ‘/api’ and ‘/health’, before sending traffic to demo-svc:8080
  • balances traffic between pods on the least connections algorithm once the traffic reaches the service (set in DestinationRule)
  • provides a custom timeout and retry mechanism is described for demo-svc in VirtualService, thus making sure that we protect it from unwanted load
  • controls the connection to the external dependency via ServiceEntry and DestinationRule, and sets up mutual TLS authentication

---
apiVersion: networking.istio.io/v1alpha3
kind: Gateway
metadata:
 name: demo-gateway
spec:
 selector:
   istio: ingressgateway
 servers:
 - port:
     number: 443
     name: https
     protocol: HTTPS
   hosts:
   - demo.example.com
---
apiVersion: networking.istio.io/v1alpha3
kind: VirtualService
metadata:
 name: demo-service
spec:
 hosts:
 - "demo.example.com"
 gateways:
 - demo-gateway
 http:
 - match:
   - uri:
       prefix: /api
   - uri:
       prefix: /health
   route:
   - destination:
       port:
         number: 8080
       host: demo-svc
   timeout: 10s
   retries:
     attempts: 3
     perTryTimeout: 2s

---
apiVersion: networking.istio.io/v1alpha3
kind: DestinationRule
metadata:
 name: demo-svc-dr
spec:
 host: demo-svc
 trafficPolicy:
   loadBalancer:
     simple: RANDOM
---
apiVersion: networking.istio.io/v1alpha3
kind: ServiceEntry
metadata:
 name: external-svc-entry
spec:
 hosts:
 - external.service.com
 ports:
 - number: 443
   name: https
   protocol: HTTPS
 location: MESH_EXTERNAL
 resolution: DNS
---
apiVersion: networking.istio.io/v1alpha3
kind: DestinationRule
metadata:
 name: external-svc-dr
spec:
 host: external.service.com
 trafficPolicy:
   tls:
     mode: MUTUAL
     clientCertificate: /etc/certs/myclientcert.pem
     privateKey: /etc/certs/client_private_key.pem
     caCertificates: /etc/certs/rootcacerts.pem
K8s clusters handling 10B daily API calls use Kubecost

This is a lot to process and visualize. Hopefully our “life of a request” diagram below will add further clarity.

This diagram is a bit of a hybrid, since it shows Istio abstractions alongside Kubernetes objects, but the aim is to highlight which definitions are responsible for traffic movement.

Life of a request within an Istio service mesh

Life of a request within an Istio service mesh

In short, requests enter the mesh via a Gateway, which has awareness of the host and route matching, described in the VirtualService. The requests then land on a demo-svc and are load-balanced by the “least-active-connection” method (described in the DestinationRule). If connections to external services are needed, they are established with mTLS authentication.

As we can see from the manifests and diagram, by instructing Envoy proxies in how they should behave via Istio resources, we are now in full control of the traffic.

Security and authentication with Envoy

Envoy functionality is also useful when augmenting the security of an Istio service mesh. We’ve mentioned already that Envoy acts as a policy enforcer inside of a mesh, which in practice means:

  • making sure that only authorized service-to-service communication can happen within the mesh (peer authentication)
  • implementing request authentication by means of JWT validation (given the necessity to act as edge proxy and thus face external sources)
  • acting as a policy enforcement point for all of the above

If we needed to secure our services from the earlier “life of a request diagram,” we would need to instruct Istio to do the following:

  • enforce mutual TLS authentication between all of our internal services either mesh-wide or per service. This would instruct Envoy to authenticate requests based on present certificates
  • set the JWT validation (multiple providers supported) on the Envoy edge proxy, which acts as ingress into the mesh
  • further control certificate expiration and renewal, keeping the secure naming and service identities updated

Some of these functionalities (such as certificate management) come out of the box, but others may need to be explicitly enabled. In our earlier manifest example, we can see that client-side mutual TLS authentication has already been enabled (see DestinationRule for external service). If on the other hand we wanted to enable peer and request authentication for that service and its mesh, the configuration would look as follows:


---
apiVersion: security.istio.io/v1beta1
kind: PeerAuthentication
metadata:
 name: "enforce-mtls"
spec:
 selector:
   matchLabels:
     app: demo-app
 mtls:
   mode: STRICT
---
apiVersion: security.istio.io/v1beta1
kind: RequestAuthentication
metadata:
name: demo-app-jwt
spec:
 selector:
   matchLabels:
     app: demo-app
 jwtRules:
 - issuer: "https://demo-tenant.us.auth0.com/"
   jwksUri: "https://demo-tenant.us.auth0.com/.well-known/jwks.json"
---
apiVersion: security.istio.io/v1beta1
kind: AuthorizationPolicy
metadata:
 name: require-jwt
spec:
 selector:
   matchLabels:
     app: demo-app
 action: ALLOW
 rules:
 - from:
   - source:
      requestPrincipals: ["*"]

As a result of this configuration:

  • the Envoy proxy (running as a sidecar in the demo-app) would only accept TLS connections via the line mode: STRICT
  • external requests landing on the Ingress gateway have to provide a valid JWT token (here we’re using Auth0 tenant as an example) in order to authenticate
  • only successfully authenticated requests would then be authorized to connect to the demo-app

We have now added a layer of security, eliminating any unwanted traffic to and from our service.

Observability as a way to understand the network

We now see how Envoy augments Istio with richer traffic management and security features, but frankly, none of this is very useful unless we can also look more deeply into the mesh itself.

The complexity of service meshes and their varied options mean that configuration mistakes or unexplained events will eventually happen. There’s really no escaping it.

In order to conduct effective debugging, in an ideal world we would need rich metrics, verbose logs, request tracing, correlation of configuration changes to mesh behavior, and more. Thankfully, this is exactly what Envoy and Istio give us.

There are three types of telemetry sources based on Envoy that are made available by Istio by default:

  • Metrics for every service within the mesh, such as error rates or traffic volume, alongside control plane metrics
  • distributed tracing: allowing us to visualize call flows and see service dependencies or sources of latency and errors
  • access logs: giving us insight into each Envoy proxy and documenting what happens to every incoming or outgoing request

Integrations with popular tools, such as Grafana and Prometheus, also come as add-ons with Istio deployments and can be adjusted during setup. This gives mesh operators the ability to enable or customize exported data and get Envoy to add or drop metric dimensions, or tell Istio to include or exclude metrics.

There are 3 types of metrics that are collected and exported by Istio:

  • proxy-level metrics: rich metrics from every sidecar that Envoy proxy has deployed, containing information on each passing request and details on configuration changes and proxy health
  • service-level metrics: these are abstracted by Istio to the level of individual services running in a mesh, covering the 4 key metrics of latency, traffic, errors, and saturation
  • control-plane metrics: provides insight into Istio components and their overall health and performance

Consumption of the Istio metrics, coming from Prometheus, can be done either from a local (to mesh) instance or via Prometheus federation with an external entity. The same can be also said when visualizing metrics via Grafana (or similar), or when using managed observability platforms like NewRelic or Datadog.

The main idea remains the same: you either keep the metrics locally or keep them and send them elsewhere for processing.

When it comes to metric customization, the flexibility of Envoy’s use of filters provides many powerful metric management options. Filters are a rather advanced topic though, and beyond the scope of this article—but to point you in the right direction, we have provided some useful examples of Envoy filter usage here and here.

With regards to distributed tracing, Istio supports tracing backends such as Zipkin and Jaeger, integrating with Envoy tracing capabilities. It must be noted however that some help from applications running in the mesh is needed, specifically surrounding the propagation of B3 (x-b3-*) and “x-request-id” headers emitted by Istio and Envoy. Configuring this differs between programming languages and HTTP servers, and you can find a good idea of what this involves here and here.

Lastly, access logs are probably the most straightforward of the observability metrics. Envoy produces access logs for both HTTP and TCP listeners and allows for the configuration of log format. Istio wraps these configurations into its configuration, exposing it via a global mesh configuration.

At the end of the day, it’s all about processing the logs from Envoy’s stdout or file output, whether for debugging or auditing purposes. You can find a short example of how to quickly explore these logs here.

Learn how to manage K8s costs via the Kubecost APIs

Extensibility of Envoy with WebAssembly

We touched briefly on the idea of Envoy filters, which are used to customize metrics and this would have been a good example of Envoy extensibility, but there are many other options.

New features called WebAssembly-based extensibility and the Proxy-Wasm configuration interface were introduced in version 1.5 of Istio.. Since then the Istio project has also led the adoption of Wasm extensibility, introducing alternative features and growing the number of available extensions.

Put simply, Wasm allows for portable, sandboxed execution of code in a self-sufficient way. Envoy supports Wasm extensions and Istio uses these as a means of customization. Additionally, the Proxy-Wasm initiative is meant to unify the way extensions are written. As an example, provided SDKs (written in C++, Rust, and AssemblyScript) are built on top of these conventions.

For the end user or mesh operator, it's all about enabling your Envoy proxies to do things outside of Envoy’s native capability. This is an advanced topic as it might require writing extensions to suit your needs, but chances are high that something’s already available in the Istio ecosystem.

Best practices and a word of caution

This article has emphasized Istio (and Envoy) seamlessly integrating with your existing infrastructure without requiring any major changes. And for most cases that’s completely true. However, the bigger and quirkier your infrastructure and apps get, the higher the chances are of facing compatibility or configuration issues. After all, Istio and Envoy bring an intermediary into what was originally direct communication, diverting requests and traffic through another layer. This extra step can sometimes cause problems for your applications.

So, before immediately rushing to build Istio into your infrastructure, keep the following in mind:

  • kubernetes deployments that simply boil down to port usage or very basic pod requirements present little problem
  • proxy awareness of applications Implementing this may or may not be required and is dependent on the software stack and boils down to having a proxy in between. A good example of such awareness is the usage of server first protocol applications, such as MySQL or MongoDB
  • header manipulation. This is applicable to HTTP traffic (the most common traffic within a service mesh) and is caused by Envoy header manipulation, which is essential to its routing capability
  • Istio brings many useful features surrounding security and traffic management, but adds complexity
  • migration process. No matter how seamless Istio is designed to be, it still requires the addition of a new component (Istio) and its insertion into every app. There is also the potential need to migrate networking objects, like Kubernetes Ingress services, onto Istio’s Gateway
  • cost of maintenance. Istio is another application in your infrastructure and needs to be monitored and updated to remain healthy. It also typically requires more experienced engineers, adding to your overheads.
  • debugging. Last but not least, debugging is never straightforward and with additional layers in the way, it definitely doesn’t get any easier. To help, there are many diagnostic tools available for Istio and Envoy

While the above points might sound a little discouraging, they’re there to set realistic expectations. If you’re already considering using a service mesh (with Istio or otherwise), the benefits will likely outweigh the complexity.

Setting up Istio in the playground

A running Kubernetes cluster: the easiest way would be to use kind on your laptop. Alternatively, Istio docs have a great selection of platform-specific cluster setups.

deploy Istio with istioctl: while some of you may not have this as a first choice, preferring Helm chart or Operator deployment instead, iistioctl is still the best way for a quick set-up.

deploy “real-life” applications: you can opt for any app of your choosing or just go with the official Bookinfo or HelloWorld app if you want to. But it’s better to have a few components in your lab that allow proper traffic flow and experimentation.

start playing: experiment with Istio functions and features to any degree, even to the point of destruction. Then, redeploy the environment with new parameters, or choose any of these tasks that might interest you

Conclusion

We hope this article has been a useful guide to getting started on your service mesh journey, or perhaps provides you with a better understanding of an existing deployment.

Comprehensive Kubernetes cost monitoring & optimization

Continue reading this series