Learn the key concepts and best practices for using Prometheus, a powerful software tool for event monitoring and alerting, with Kubernetes.

Prometheus Kubernetes and Kubernetes Integration

The first Cloud Native Computing Foundation (CNCF)-incubated project, Kubernetes, has emerged as the de-facto standard for container orchestration. While not as famous as Kubernetes, the second CNCF-incubated project, Prometheus (made open source by Soundcloud in 2015), has become one of the most popular container-monitoring tools.

Kubernetes and Prometheus are closely related as they are essential to modern cloud-native environments. For example, the Kubelet, the API Server, the Controller Manager, and the Scheduler, all key Kubernetes components, expose their built-in metrics in the Prometheus format. In other words, Kubernetes and Prometheus work together to ensure a Kubernetes cluster and that the applications deployed on it are monitored effectively.

This article will explore the key concepts around Prometheus and the best practices when using Prometheus with Kubernetes.

Summary of key Prometheus and Kubernetes best practices

The table below summarizes the five Prometheus and Kubernetes best practices we will explore in this article.

Best Practice Description
Be selective with the metrics you monitor Select which cluster and pod metrics to start monitoring for an initial config
Optimize target labeling and cost Optimize resources and cost in the cluster by controlled and organized labeling
Set up alert rules Set well-defined alerts and appropriate thresholds
Implement proper data retention Define and implement data storage retention policies and be mindful of the generated data
Monitor Prometheus itself Set alerts based on Prometheus metrics to monitor for unusual spikes

Getting started with Prometheus

Prometheus can provide deep insights into the health, performance, cost, and resource utilization of Kubernetes clusters and their workloads.

Prometheus stores all of this data in a time-series database which was purpose-built to store metrics data efficiently. Prometheus’s custom and flexible query language, PromQL, can query this data. From here, users can configure alerts based on predefined thresholds. Data can be integrated via PromQL into other GUI tools, such as Grafana, to visualize the system performance analytics.

There are multiple ways to install and configure Prometheus, but in the context of already having a Kubernetes cluster, the easiest solution is to use the open-source Helm Charts.

Helm is Kubernetes’ package manager, and many popular applications have a pre-built package, including Prometheus. To simply install Prometheus with Helm, run the following commands:

helm repo add prometheus-community https://prometheus-community.github.io/helm-charts
helm repo update
helm install my-prometheus prometheus-community/prometheus

Alternatively, there are managed offerings that can optionally enable Prometheus for the Kubernetes cluster, such as Azure AKS or applications in Kubernetes clusters that already come prepackaged with Prometheus. For example, if using Kubecost, Prometheus is pre-installed, but you also have the option to bring your own Prometheus.

Prometheus Kubernetes integration

Prometheus integrates deeply with Kubernetes, leveraging its native functionalities for effective monitoring and alerting. One significant integration is Kubernetes service discovery, where Prometheus can automatically discover and scrape metrics from Kubernetes API endpoints. Kubernetes exporters also enable Prometheus to locate and monitor metrics for various services automatically.

Comprehensive Kubernetes cost monitoring & optimization

With regards to Kubernetes-specific exporters, the most widely used ones are the kube-state-metrics and node-exporter, which generate metrics about the internal Kubernetes objects (e.g., jobs, services, pods, etc.) and cluster nodes resources (e.g., CPU and RAM.) respectively. For instance, Prometheus can collect CPU and memory metrics from all pods labeled “app=frontend” within the namespace “production,” enabling targeted monitoring.

Another notable integration lies in Prometheus’ ability to track Kubernetes events. By collecting and analyzing these events, Prometheus can alert on critical occurrences like pod crashes or failed deployments, aiding in proactive issue resolution within Kubernetes clusters.

Alertmanager is the component within Prometheus responsible for alert notifications, grouping, deduplication, and routing to various notification channels like email, Slack, PagerDuty, or other systems.

These integrations allow for granular monitoring and timely response to changes or incidents within the Kubernetes cluster and infrastructure.

Among the most commonly used integrations in a Kubernetes and Prometheus stack is Grafana. Prometheus seamlessly integrates with Grafana, a powerful visualization tool that allows users to create insightful dashboards based on Prometheus data sources. This integration empowers users to craft visually rich displays by enabling them to write custom PromQL queries that transform raw metrics into meaningful insights for efficient monitoring and decision-making.

Five essential Prometheus and Kubernetes best practices

With the basics out of the way, let’s jump into five best practices teams can use to get the most out of using Prometheus and Kubernetes together.

Be selective with the metrics you monitor

The metrics that will be monitored are vital to get started with Prometheus. While this best practice might seem simple, it is often overlooked.

There is an abundance of metrics available within Kubernetes and deployed applications. Without a selective approach, users may unnecessarily collect all available metrics and logs. This could lead to unnecessary costs and overload Prometheus data storage.

Pick the metrics that matter most to you, and configure Prometheus to start scraping those metrics.

Scrape Configs

Scrape configs are settings in Prometheus that tell it what data to collect. These settings are found in the prometheus.yml file that comes with Prometheus. In the prometheus.yml file, scrape_configs contains details for the collection jobs.

By default, a job named “prometheus” collects data from the Prometheus server itself.

You can see an example of this file on the Prometheus GitHub page, or check out a more complex example with several jobs if you're using the Prometheus Helm Chart.

A simplified example of a Prometheus configuration that scrapes metrics every 15 seconds from pods labeled with “app=demo-app” within a namespace called “mynamespace” can be seen here:

global:
  scrape_interval: 15s  # Set the interval for scraping metric
scrape_configs:
  - job_name: 'kubernetes-pods'  # Job name for identification
    kubernetes_sd_configs:
      - role: pod  # Specify that the scraping target is a pod
    relabel_configs:
      - source_labels: [__meta_kubernetes_pod_label_app]  # Filter pods by label 'app'
	 action: keep
	 regex: demo-app
      - source_labels: [__meta_kubernetes_namespace]  # Filter pods by namespace
	 action: keep
	 regex: my-namespace

Once this configuration is in place, users can add more scrape configurations for other Kubernetes components such as nodes, additional services, or Kubernetes system pods such as kubelet or the kube-proxy. The full syntax and configuration options that can be configured can be found in the Prometheus documentation for scrape_configs.

Optimize target labeling and cost

Optimizing resource management in a Kubernetes cluster relies on adequate target labeling and a proper scraping strategy. By systematically labeling resources like pods, services, and nodes, Prometheus can selectively gather essential metrics.

K8s clusters handling 10B daily API calls use Kubecost

A basic example can be seen in the above section. For instance, a basic labeling strategy for pods is to include the name of the application they are part of or the environment, i.e., “app=myapp” and “environment=dev/test/prod.” Here is an example command that illustrates how to label a pod using kubectl:

kubectl label pod demo environment=prod

Here, a pod named “demo” is getting the label “environment” with the value “prod.”

In this example, Prometheus can ingest specific application components or environment types, facilitating targeted monitoring. Similarly, labeling nodes by different hardware specifications, i.e., “gpu=true,” will help monitor specialized resources. An organized labeling strategy will empower efficient computing resource allocation and enable proactive identification of potential issues within the Kubernetes cluster and applications.

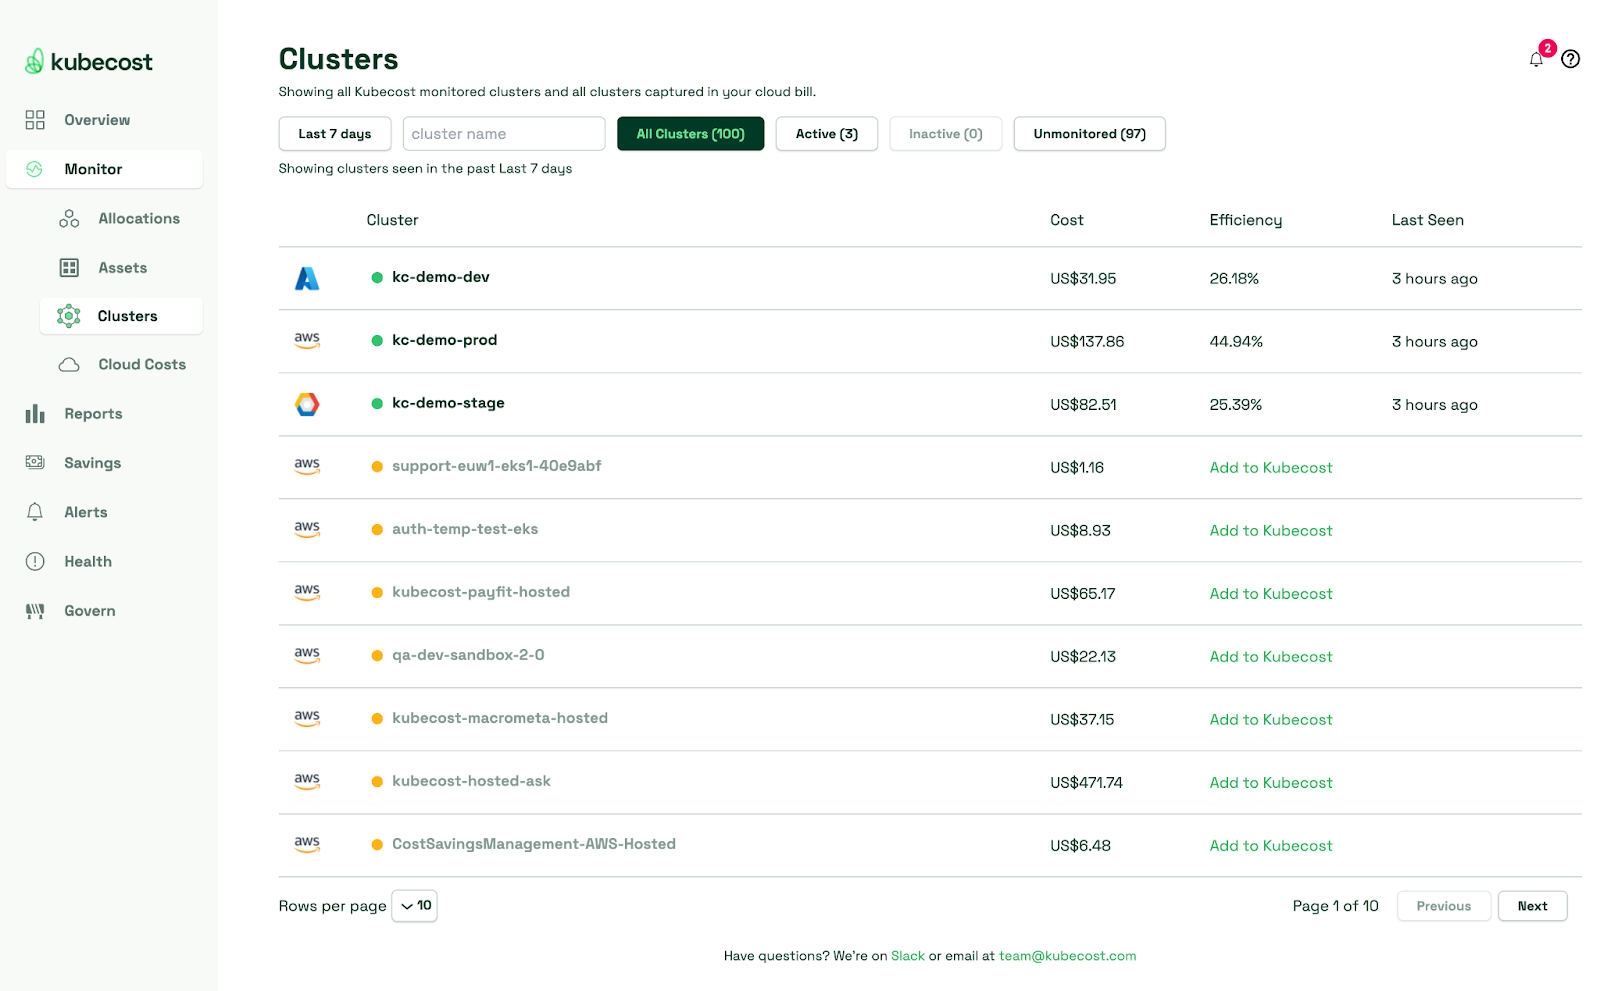
Costs can be kept down by not immediately ingesting any metrics that become available for ingestion from the Kubernetes cluster; instead, as described in the previous section, build incrementally and scrape metrics as needed. In addition, costs can also be monitored in detail by using managed platforms like kubecost that use Prometheus behind the scenes to scrape for Kubernetes metrics(i.e., “node_total_hourly_cost”) and illustrate cost graphs in multiple breakdowns that allow for enhanced visibility.

Set up alert rules

You can set up alerts for any metric Prometheus collects. To do this, create a YAML file, such as alert_rules.yaml, and populate it with your alert rules. Next, include this file in the rule_files section of your primary prometheus.yml configuration file, which will integrate it into Prometheus for monitoring, for example:

rule_files:
- alert_rules.yaml

Alerts must be clearly defined, and setting up such alerts must be done with suitable thresholds. As a best practice, define alerts that pinpoint potential issues by establishing thresholds for metrics like CPU, memory, or network error rates. Some example alerts could be the following:

  • Alert when RAM goes beyond a specified limit for an individual pod, node, or for the Kubernetes Cluster as a whole
  • Alert on individual Kubernetes resources, such as when there is latency in the Kubernetes API itself
  • Configure alerting on individual jobs in the cluster in case they fail or if they have been running longer than expected.
  • An alert could be created to trigger when a pod’s, node’s or the cluster’s CPU usage surpasses a certain percentage. An example configuration of alert_rules.yaml containing such an alert which is triggered when the CPU goes over a threshold in a pod, can be seen here:
groups:
- name: kubernetes-alerts
  rules:
  - alert: ClusterCPULoadHigh
    expr: sum(kube_pod_container_resource_limits{resource="cpu"}) - sum(kube_node_status_capacity_cpu_cores) > 0
    for: 5m
    labels:
      severity: warning
    annotations:
      summary: "High CPU load across the cluster"
      description: "CPU utilization in the cluster exceeds available capacity for the last 5 minutes."

In this example, an alert named “ClusterCPULoadHigh'' is defined, which is only triggered if the “expr” PromQL query holds true for the duration of the “for” value, which is five minutes. The “expr” query will calculate the total number of CPU limits across all pods in the cluster, and compare it with the sum of CPU limits across all nodes in the cluster. If the result is positive, the alert will trigger, indicating high CPU utilization in the cluster. A very good starting point on what metrics are available from Kubernetes can be seen in the official documentation and the Kubecost metrics page.

All these metrics can be configured depending on the needs of each use case. By establishing these straightforward alerts and thresholds, Prometheus will actively monitor your Kubernetes system and apps and promptly notify you of deviations, ultimately helping prevent potential performance issues and enabling timely actions from platform teams. These actions will help maintain a healthy Kubernetes environment.

Implement proper data retention

The storage system in Prometheus is a time series database(TSDB) designed specifically for handling and storing time-series data collected from monitored systems and applications.

Learn how to manage K8s costs via the Kubecost APIs

The actual storage medium for the TSDB Prometheus database is offered in two flavors. There is the option of sticking with local storage only, i.e. the server or pod disk that Prometheus is installed on, or integration with external storage systems.

Establishing data storage retention policies is crucial for effective resource management regardless of the choice. Setting retention durations balances the trade-off between storing historical metrics for analysis and managing storage costs. Longer retention enables deeper historical analysis, aiding in trend identification and capacity planning. However, it increases storage requirements, which could lead to the need for more storage servers to hold these additional data. On the other hand, shorter retention times reduce storage needs but limit historical insights. Implementing these policies demands a balanced approach; storing critical data for actionable insights while avoiding excessive storage costs will ensure an optimal balance between historical analysis and resource utilization within Prometheus and the Kubernetes Cluster.

With local storage the option to configure retention is “--storage.tsdb.retention.time”, with a default value of 15 days. However, if using third-party storage systems, you have the option to offload data from Prometheus for longer-term storage, integrate with other Prometheus servers you might have, or even consolidate data by using one of the existing Prometheus integrations, such as ElasticSearch, Thanos, Google BigQuery, and Kafka to name a few.

Another key point worth mentioning is that Prometheus does not provide high-availability functionality out of the box; by leveraging one of the third-party storages, administrators can implement highly available and redundant storage and expose Prometheus metrics without any downtime.

Monitor Prometheus itself

We must remember that Prometheus is also an application. Therefore, we should monitor Prometheus for reliability and performance. Implementing checks for disk usage, memory consumption, and query latency allows proactive identification of potential issues. Additionally, monitoring the health of components like the storage database, ingestion rate, and alerting pipeline ensures timely detection of anomalies.

Since Prometheus exposes data about itself, it is able to monitor its own health. A very good example of how to do this is the scrape_configs section in the main Prometheus configuration file. It contains one job for Prometheus to itself on port 9090.

global:
  scrape_interval:     15s # By default, scrape targets every 15 seconds.

  # Attach these labels to any time series or alerts when communicating with
  # external systems (federation, remote storage, Alertmanager).
  external_labels:
    monitor: 'codelab-monitor'

# A scrape configuration containing exactly one endpoint to scrape:
# Here it's Prometheus itself.
scrape_configs:
  # The job name is added as a label `job=<job_name>` to any timeseries scraped from this config.
  - job_name: 'prometheus'

    # Override the global default and scrape targets from this job every 5 seconds.
    scrape_interval: 5s

    static_configs:
      - targets: ['localhost:9090']

By already having Prometheus as part of Kubernetes, the existing emitted metrics from Kubernetes (e.g., at the node or pod levels) can additionally be leveraged to build more detailed PromQL queries and alerts, which will lead to increased observability for the Prometheus application. By establishing the above monitoring best practices, administrators can uphold the stability of Prometheus itself.

Conclusion

Using Prometheus as the application of choice to introduce monitoring and alerting for a Kubernetes cluster involves a systematic, step-by-step approach. Starting with a deliberate start-small strategy will help to understand the critical metrics, allowing for a gradual expansion, eventually leading to comprehensive system observability.

Effective target labeling will help organize the applications within a Kubernetes cluster and, more crucially, help with PromQL query efficiency. Also vital is the establishment of alert rules within Prometheus. These rules act as sentinels, preempting potential issues by flagging irregularities based on predefined thresholds set by the administrators or application owners; specific to each use case.

Implementing thorough data retention policies or integrating third-party storage systems for longer storage is crucial for informed decision-making and historical analysis.

Finally, treating Prometheus as another application that needs to be monitored is equally important to ensure everything that it already is doing remains robust and reliable. These guidelines provide a path to implementing and learning more about Prometheus and its integration into Kubernetes.

Comprehensive Kubernetes cost monitoring & optimization

Continue reading this series