Learn how to monitor Kubernetes applications and infrastructure with logs, metrics, traces, and events for cost-effective performance optimization.
🎉 Kubecost 2.0 is here! Learn more about the massive new feature additions and predictive learning

Kubernetes Observability: Tutorial & Best Practices

In the dynamic world of containerized applications, Kubernetes has become the go-to orchestrator. However, ensuring that your applications perform optimally and remain cost-efficient is no small feat.

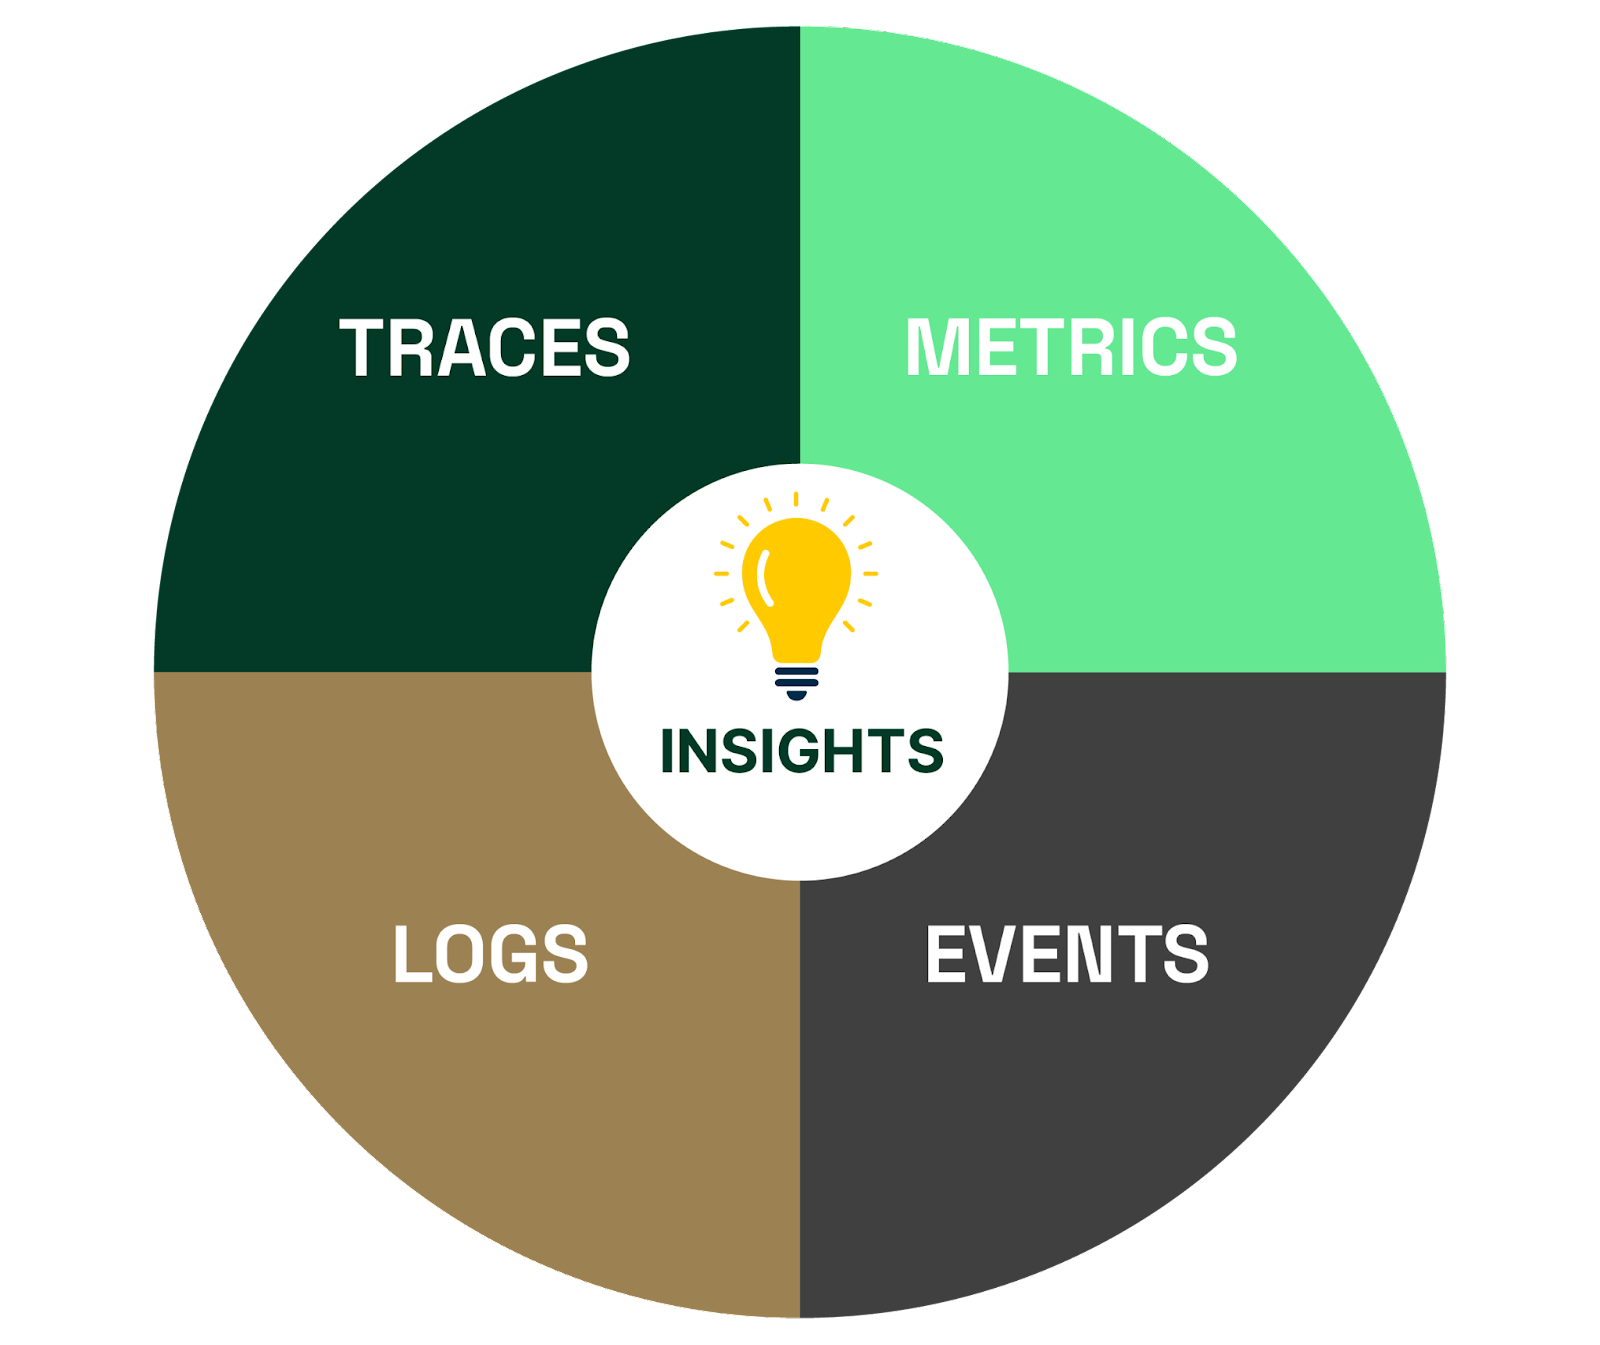
Traditional monitoring tools fall short when it comes to Kubernetes. The dynamic and ephemeral nature of containers makes it challenging to keep track of what's happening in your cluster without observability. Here’s why it matters:

  • Quick issue resolution: When an issue arises, observability tools provide the data needed for rapid troubleshooting and resolution, reducing downtime.
  • Performance optimization: Observability helps you identify performance bottlenecks and resource inefficiencies, enabling you to optimize your applications.
  • Resource efficiency: By understanding resource usage, you can right-size your containers and clusters, minimizing unnecessary costs.
  • Security: Logs and traces can assist in detecting and responding to security incidents, helping you maintain a secure environment.

In this article, we delve deeper into the essential components of Kubernetes observability, provide practical guidance on their implementation, and explore how observability contributes to cost management within your Kubernetes deployments. We also offer hands-on guidance and best practices to ensure that your Kubernetes deployments run smoothly, maintaining cost-effectiveness and achieving operational excellence. By the end of this article, you’ll have the insights and tools you need to optimize performance while keeping your Kubernetes ecosystem running efficiently and cost-effectively.

Summary of key Kubernetes observability concepts

Concept Description
Kubernetes observability Kubernetes observability is the practice of comprehensively monitoring containerized applications and infrastructure within Kubernetes clusters.
Essential observability components The core components of Kubernetes observability include logs, metrics, traces, and events, each crucial for understanding system behavior and performance.
Implementing Kubernetes observability Implementing Kubernetes observability involves practical guidance on using tools such as the Elastic Stack (Elasticsearch, Logstash, Kibana), Grafana with Prometheus, and Jaeger with Istio effectively within Kubernetes environments.
Kubernetes cost management Kubernetes cost management concepts include resource allocation, cluster scaling, and cost monitoring strategies like utilizing cloud provider billing metrics, implementing resource quotas, and leveraging auto-scaling policies.
Best practices for observability and cost Best practices encompass proper resource tagging, setting up alerts and notifications, leveraging cost allocation labels, establishing cost control policies, and focusing on meaningful logging practices.
Challenges and considerations Common issues include high-cardinality data, resource overhead, and security concerns.
Future trends in observability and cost Emerging trends include AI-driven anomaly detection, serverless and microservices observability, and the evolution of Kubernetes-native observability and cost management solutions.

Understanding Kubernetes observability

Kubernetes observability is the practice of gaining comprehensive insights into containerized applications and the underlying infrastructure in a Kubernetes environment. It’s about being able to answer crucial questions like these:

  • How are my containers performing?
  • Are there any bottlenecks?
  • Is my application behaving as expected?

Observability in distributed systems typically includes three pillars - logs, metrics, and traces. Kubernetes introduces events as an additional rich source of information. These four components make it a perfect combination for measuring Google’s prominent Four Golden Signals - latency, traffic, errors, and saturation.

  • Latency refers to the time it takes for a service to process a request and return a response. Latency is a critical performance metric that measures the delay or time lag experienced by users or client systems when interacting with a service.
  • Traffic refers to the volume of requests or interactions that a service receives within a specific time period. It is one of the key performance indicators used to assess the health and reliability of a service.
  • Errors refer to unexpected or undesirable events when a service processes a request. While logs and traces can provide additional context about specific errors, metrics, and events are the primary means for continuous monitoring of error rates.
  • Saturation refers to the utilization of critical resources within a service or system. Saturation monitoring helps service operators proactively identify resource constraints and capacity bottlenecks, allowing them to take corrective actions before they impact the user experience.

Kubernetes observability is a four-fold concept that encompasses logs, metrics, traces, and events. These four components provide a holistic view of your applications and infrastructure within Kubernetes:

  • Logs: This pillar includes both application and system logs. Application logs are invaluable records of events and actions within your applications that contain valuable information for troubleshooting issues and monitoring application behavior. System logs are records generated by an operating system that capture essential events, errors, and activities to assist in monitoring, troubleshooting, and maintaining system health; they may include security, network, access, and error logs.
  • Metrics: Metrics are quantitative data points that give you a continuous stream of information about your system’s performance. Kubernetes generates a wealth of metrics related to resource usage, application health, and cluster behavior. Metrics allow you to understand trends, set alerts, and make data-driven decisions.
  • Traces: Traces provide a detailed view of the journey a request or transaction takes through your microservices. This is particularly essential in a containerized, distributed environment where applications are composed of many smaller services. Tracing helps you pinpoint performance bottlenecks and understand dependencies.
  • Events: These real-time notifications of significant occurrences within the cluster, such as pod lifecycle events and configuration changes, offer insights into the cluster’s health and state.

The four pillars of Kubernetes observability (source)

We explore these pillars of observability in more detail in the next section.

Essential observability components

As mentioned above, in Kubernetes, observability is achieved through a set of four essential components: logs, metrics, traces, and events. Each of these components plays a critical role in understanding the behavior and performance of your containerized applications.

Logs: Uncovering insights in textual data

Logs are the textual records of events, activities, and errors within your containers and applications. They are the first line of defense when something goes wrong, providing essential clues for debugging and troubleshooting.

ELK stack (source)

The ELK stack (or Elastic stack), composed of Elasticsearch, Logstash, and Kibana, is one of the most popular solutions for log collection and aggregation:

  • Elasticsearch: Elasticsearch is a distributed search and analytics engine designed to store, search, and analyze large volumes of data quickly. It serves as the storage back-end for log data, enabling fast and efficient log retrieval.
  • Logstash: Logstash is an open-source data ingestion and transformation tool. It collects logs from various sources, processes them, and sends them to Elasticsearch. Logstash provides flexibility in parsing and enriching log data before storage.
  • Kibana: Kibana is a user-friendly visualization and exploration platform that complements Elasticsearch. It allows you to create custom dashboards and search and analyze log data stored in Elasticsearch, providing a rich interface for log exploration.

The ELK stack is a popular choice for log collection and aggregation in Kubernetes due to its scalability, flexibility, and robust feature set. It enables efficient log management and real-time analysis, empowering you to troubleshoot issues and effectively monitor the health of your Kubernetes environment.

Comprehensive Kubernetes cost monitoring & optimization

Alerting on logs provides the advantage of proactive issue detection. For instance, by setting up alerts for critical error logs in a Kubernetes application, you can instantly notify the operations team when an issue occurs, enabling swift resolution before there are impacts on users or system performance. Tools like ElastAlert or Kibana Alerts can be used for such purposes.

Metrics: Quantifying system and application health

Metrics provide quantitative data about the performance and health of your Kubernetes cluster, nodes, and applications. They enable you to monitor resource usage, identify trends, and set up anomaly alerts.

Grafana and Prometheus Kubernetes cluster monitoring (source)

Tools for metric collection and querying include the following:

  • Prometheus: Prometheus is a widespread open-source monitoring and alerting toolkit that excels at collecting, storing, and querying metrics. Prometheus is designed to work seamlessly with Kubernetes and can scrape metrics from various sources, including Kubernetes services and pods.
  • Grafana: Grafana is a powerful visualization and alerting platform that pairs beautifully with Prometheus, allowing you to create informative dashboards and set up alerts based on metrics data.
  • Kubernetes Metrics Server: The Kubernetes Metrics Server is an official Kubernetes component that collects resource metrics from the kubelet and exposes them in the Kubernetes API. It’s essential for tools like the Horizontal Pod Autoscaler (HPA).
  • kubectl top: Although not a robust collection or query tool, “kubectl top” deserves an honorable mention. It offers a quick check on resource status and is a handy command-line utility for obtaining a snapshot of resource usage in your Kubernetes cluster.

Alerting on metrics is critical to maintaining the health and performance of a Kubernetes environment. One notable tool for metric-based alerting is Alertmanager, which works seamlessly with Prometheus. It’s worth noting that while Alertmanager is a powerful choice, it’s also insightful to compare it with Grafana Alerts, which comes with Grafana. This article can offer valuable insights into these alerting solutions' comparative strengths and use cases.

Traces: Visualizing application workflows

Traces visually represent how requests or transactions flow through your microservices. In Kubernetes, where applications are often composed of multiple services, tracing helps you understand the journey of a request and identify bottlenecks.

Tools for distributed tracing include:

  • Jaeger: Jaeger is an open-source, end-to-end, distributed tracing system. It’s particularly valuable in Kubernetes environments with microservices architectures because it allows you to trace requests across services.
  • Zipkin: Zipkin is another distributed tracing system that helps you track the paths of requests through various application components.

Many service meshes seamlessly integrate with tracing tools, simplifying collecting and visualizing distributed traces. Istio, for instance, allows its proxies to send tracing spans directly to Jaeger without requiring any modifications to the application’s code, eliminating the need for additional client libraries or complex configurations.

Distributed tracing with Istio (source)

This native compatibility streamlines observability in microservices environments and enhances visibility into application behavior.

Events: Capturing significant occurrences

Events provide real-time notifications of significant occurrences within your Kubernetes cluster. These occurrences include pod lifecycle events, configuration changes, or security alerts. Kubernetes events are valuable for monitoring the health and state of your cluster.

Kubernetes provides an events API that can be accessed through the Kubernetes control plane. You can use kubectl or tools like kubewatch to monitor and respond to events in real-time.

To monitor and respond to events in real-time using kubectl, you can utilize the kubectl get events command with the --watch flag. This command fetches the latest events from your Kubernetes cluster and continuously updates them as new events occur. For example:

kubectl get events --watch

Kubewatch is a Kubernetes watcher that provides real-time notifications for various events. To use Kubewatch, you first need to install it in your cluster, which we will cover in the next section.

K8s clusters handling 10B daily API calls use Kubecost

Implementing Kubernetes observability

Now that we have a grasp of what Kubernetes observability is and why it’s important, it’s time to go into the practical aspects of implementing it within your Kubernetes clusters. This section will guide you through the essential steps and best practices for establishing a robust observability strategy.

Setting up log collection and aggregation

For this section, we will use Elastic Cloud on Kubernetes (ECK), which is built on the Kubernetes Operator pattern. It extends basic Kubernetes orchestration capabilities to support the setup and management of Elasticsearch, Kibana, APM Server, Enterprise Search, Beats, Elastic Agent, Elastic Maps Server, and Logstash on Kubernetes.

Step 1: Prerequisites

Ensure that you meet the following prerequisites:

  • A Kubernetes cluster (e.g., Minikube, GKE, or EKS)
  • Helm installed on your local machine
  • The kubectl command-line tool for Kubernetes

Step 2: Install Elastic Stack

Add the Elastic Helm charts repository to Helm:

helm repo add elastic https://helm.elastic.co

Update the Helm repositories:

helm repo update

Set up an Elasticsearch cluster with a simple Kibana instance managed by ECK:

# Install an eck-managed Elasticsearch and Kibana using the default values, which deploys the quickstart examples.
helm install es-kb-quickstart elastic/eck-stack -n elastic-stack --create-namespace

Step 3: Configure log forwarding

To send logs from your applications to Logstash, configure your application’s logging settings. For instance, in a Dockerized Node.js application, you can use libraries like winston to set up log forwarding:

const winston = require('winston');
require('winston-logstash');

const logger = winston.createLogger({
  transports: [
    new winston.transports.Logstash({
      host: 'logstash-service', // Replace with your Logstash service hostname
      port: 5044,               // Logstash port
      format: winston.format.combine(
        winston.format.timestamp(),
        winston.format.json()
      ),
    }),
  ],
});

// Log events using 'logger'

Step 4: Access Kibana

A ClusterIP service is automatically created for Kibana:

kubectl get service elastic-stack-kb-http

Use kubectl port-forward to access Kibana from your local workstation:

kubectl port-forward service/quickstart-kb-http 5601

Open https://localhost:5601 in your browser. Your browser will show a warning because the self-signed certificate configured by default is not verified by a known certificate authority and not trusted by your browser. You can temporarily acknowledge the warning for the purposes of this tutorial, but it is highly recommended that you configure valid certificates for any production deployments.

Log in as the elastic user. The password can be obtained with the following command:

kubectl get secret elastic-stack-es-elastic-user -o=jsonpath='{.data.elastic}' | base64 --decode; echo

For further details, you can reference the Elastic Cloud Quickstart Guide.

Configuring metrics collection with Prometheus

Prometheus is the go-to solution for collecting and querying metrics in Kubernetes. It uses a pull-based model, regularly scraping metrics from various targets, including Kubernetes components, applications, and services.

We have a separate in-depth tutorial on setting up Prometheus and Grafana here.

Implementing distributed tracing

Let’s review a specific example of where distributed tracing can be used effectively. Imagine that you’re running an e-commerce platform with a microservices architecture hosted on Kubernetes. Your application consists of multiple microservices, including user authentication, a product catalog, a shopping cart, payment processing, and order fulfillment.

In this scenario:

  • A user initiates a purchase by adding items to a shopping cart.
  • The shopping cart service communicates with the product catalog service to fetch the product details.
  • Once the user proceeds to checkout, the payment processing service is called to handle the transaction.
  • After successful payment, the order fulfillment service prepares and ships the order.

Here’s where distributed tracing becomes crucial:

  • Understanding request flow: With distributed tracing, you can visualize the entire journey of a user’s request as it flows through these microservices. You can trace how the request starts from the shopping cart, interacts with the product catalog, moves to payment processing, and reaches order fulfillment.
  • Identifying bottlenecks: Distributed tracing helps you identify bottlenecks or delays in the request flow, especially when combined with load testing. For instance, you may discover that the payment processing service is taking longer than expected to authorize payments, causing delays in order fulfillment.
  • Troubleshooting errors: When errors occur during the purchase process, distributed tracing allows you to pinpoint the exact microservice where the error originated. For example, you can determine whether an issue is in the shopping cart service, product catalog service, or elsewhere.
  • Optimizing performance: By analyzing trace data, you can optimize the performance of your microservices. You might discover that certain services consume excessive resources or experience high latencies, enabling you to fine-tune them for better efficiency.

Here’s how to implement distributed tracing with Istio in your Kubernetes cluster.

Learn how to manage K8s costs via the Kubecost APIs

Step 1: Deploy Istio

As a prerequisite to this demo, install istioctl following their official guidelines.

Deploy Istio into your Kubernetes cluster using the official Istio installation guide.

istioctl install

Step 2: Enable tracing in Istio

Enable tracing for Istio by applying the tracing configuration. This step configures Istio’s sidecar proxies to send tracing spans to Jaeger:

kubectl apply -n <namespace> -f https://raw.githubusercontent.com/istio/istio/release-1.11/samples/addons/jaeger.yaml

Replace <namespace> with your desired namespace.

Step 3: Deploy your applications

Deploy or update your microservices applications to run within the Istio service mesh.

Step 4: Explore traces with Jaeger

Access the Jaeger UI to explore distributed traces by finding the Jaeger service URL:

kubectl get svc -n <namespace> | grep jaeger-query

Open the Jaeger UI in your web browser using the provided URL.

Step 5: Analyze distributed traces

In the Jaeger UI, you can search for traces by service, operation, or time range. Analyze distributed traces to gain insights into the request flow, latency, and interactions among services. This valuable information can help troubleshoot issues and optimize your microservices applications.

Using Kubewatch to monitor and respond to events

To use Kubewatch, you first need to install it in your cluster and then configure it to send notifications to your preferred channels (e.g., Slack, email, or others).

Here’s a simplified example of installing and configuring Kubewatch.

First, install Kubewatch:

kubectl create namespace kubewatch
kubectl apply -f https://raw.githubusercontent.com/bitnami-labs/kubewatch/master/kubewatch-config.yaml -n kubewatch

Next, configure Kubewatch to send notifications to Slack:

kubectl edit configmap -n kubewatch kubewatch-config

In the editor, add your Slack webhook URL and customize other settings as needed, then deploy Kubewatch:

kubectl apply -f https://raw.githubusercontent.com/bitnami-labs/kubewatch/master/kubewatch-docker.yaml -n kubewatch

Kubewatch will now continuously monitor Kubernetes events and send real-time notifications to your configured channels. You can customize which types of events you want to receive notifications for in the Kubewatch configuration.

Kubernetes cost management

In the realm of Kubernetes, achieving optimal performance is just one part of the equation. Cost management is equally critical, especially in dynamic, cloud-native environments. This section is your guide to understanding how to manage costs effectively while ensuring that your Kubernetes deployments remain efficient and budget-friendly.

Right-sizing resources

One of the fundamental principles of Kubernetes cost management is right-sizing resources, which means aligning the CPU, memory, and other resources allocated to your containers and pods with actual application needs. By avoiding overprovisioning, you can significantly reduce cloud infrastructure costs.

Autoscaling for efficiency

Kubernetes provides autoscaling capabilities, allowing your cluster to adjust resources based on demand automatically. Leveraging Horizontal Pod Autoscaling (HPA) and the Cluster Autoscaler helps ensure you’re only paying for resources when needed, reducing costs during periods of lower traffic.

Resource quotas and limits

Resource quotas and limits are guardrails that prevent individual applications or teams from consuming excessive amounts of resources. By setting these quotas appropriately, you can avoid resource contention, reduce costs, and maintain cluster stability.

Cost allocation and monitoring

Effective cost management requires clear visibility into where your Kubernetes spending goes. Implementing cost allocation strategies, such as labels and annotations, helps you attribute costs to specific teams or projects. At the same time, continuous monitoring of resource utilization and spending patterns enables proactive cost optimization.

Utilizing spot instances and reserved instances

In cloud environments like AWS and Azure, leveraging spot instances or reserved instances can lead to substantial cost savings. Spot instances are available at a lower price but can be terminated with short notice, making them suitable for stateless workloads. Reserved instances offer discounted rates for predictable workloads.

Container image optimization

Optimizing container images by removing unnecessary dependencies, reducing image sizes, and employing efficient packaging practices can lead to faster container startup times and lower costs for storage and network transfer.

Policy-based governance

Implementing policy-based governance using tools like Open Policy Agent (OPA) allows you to enforce cost management policies across your Kubernetes clusters. You can define rules to terminate or resize resources that exceed cost thresholds automatically.

Cost optimization tooling

Several cost optimization tools, such as Kubecost and AWS Cost Explorer, are designed to help you gain insights into your Kubernetes spending and identify areas for cost reduction.

Best practices for observability and cost

Observability and cost management are two crucial aspects of Kubernetes operations. Combined effectively, they can ensure that your Kubernetes ecosystem operates efficiently, performs well, and remains cost-effective. This section outlines best practices for achieving observability and cost management harmony.

Implement resource tagging

Use resource tagging in your cloud provider or Kubernetes clusters. Tags enable cost allocation, helping you attribute costs to specific teams, projects, or environments. This level of granularity is essential for effective cost management.

Set up alerts and notifications

Establish alerting mechanisms based on observability data. Configure alerts to notify you when specific thresholds are breached, whether related to application performance or cost overruns. Timely alerts enable proactive responses to issues.

Leverage cost allocation labels

Leverage labels or annotations in your Kubernetes environment to allocate costs accurately. Ensure that each resource or workload is tagged with relevant cost allocation labels, making it easier to track spending by project or department.

Establish cost control policies

Define cost control policies based on your budget and objectives. Implement policies that automatically scale resources, adjust configurations, or trigger alerts when costs exceed predefined thresholds.

Implement meaningful logging practices

Emphasize the importance of meaningful log messages within your applications. Follow best practices for categorizing logs into errors, warnings, informational messages, and debug information. Ensure that log categories are used appropriately to provide insight into application behavior and potential issues. To reduce log noise, Configure application launch settings to display only the relevant log categories (such as errors, warnings, and info). This thoughtful logging approach will greatly aid future troubleshooting efforts and improve observability.

Challenges and considerations

Observability and cost management in Kubernetes bring about unique challenges and considerations that require careful attention. Let’s explore a few of these challenges and examine the considerations with the help of examples.

High-cardinality data

When monitoring microservices in Kubernetes, high-cardinality data—unique labels, tags, or dimensions—can overwhelm observability tools and increase costs. Carefully plan your label strategies to balance data granularity with tool performance.

For example, in a Kubernetes cluster hosting multiple microservices, each with unique versions and environments, the combination of labels for version, environment, and service can create high cardinality. Consider aggregating labels when possible to reduce data volume.

Resource overhead

Implementing observability and cost management tools can introduce resource overhead to your Kubernetes cluster, impacting its performance. Choose lightweight, efficient tools and scale them appropriately to avoid resource contention.

For example, Installing a resource-intensive observability agent on every pod in a large Kubernetes cluster can increase CPU and memory usage. Consider using agents that are resource-efficient or use sidecar containers to share resources.

Security and compliance

Ensure that your observability and cost management solutions align with security and compliance requirements. Handling sensitive data or exposing dashboards publicly can lead to security breaches or compliance violations.

For example, If your observability tool exposes sensitive information like user data in logs or dashboards, this can lead to privacy violations. Implement access controls, encryption, and data anonymization to protect sensitive data.

Conclusion

In the fast-paced world of Kubernetes, observability and cost management are not just buzzwords but vital strategies for success. In this article, we explored how harnessing the power of observability tools like Prometheus and tracing solutions such as Jaeger can help you gain unprecedented insights into your containerized applications. We also highlight the often-overlooked but equally critical aspect of cost management, ensuring that your Kubernetes ecosystem operates efficiently without breaking the bank.

Combining observability with cost management using tools like Kubecost is your key to achieving harmony between performance and fiscal responsibility in Kubernetes. By following best practices, and by staying attuned to emerging trends, you’ll be well-equipped to navigate the ever-evolving landscape of cloud-native technologies. As you continue your journey in Kubernetes, remember that observability and cost management are not just strategies—they’re the bedrock of a robust, cost-effective, high-performing container orchestration environment.

Comprehensive Kubernetes cost monitoring & optimization

Continue reading this series