Learn how to use Grafana monitoring to improve DevOps Research and Assessment (DORA) metrics, enhancing SDLC performance and providing better value.
🎉 Kubecost 2.0 is here! Learn more about the massive new feature additions and predictive learning

Grafana Kubernetes Dashboard: Tutorial

Like this Article?

Subscribe to our Linkedin Newsletter to receive more educational content

Subscribe now

DevOps Research and Assessment (DORA) metrics enable you to identify areas of weakness in your software development lifecycle (SDLC). Active monitoring and alerting during crucial moments—such as a rollout or when addressing a performance issue—let your team respond quickly, increasing deployment frequency and recovery time.

These metrics empirically show your business how responsive your team’s software delivery is. When combined with other metrics, such as those assessing application and infrastructure costs, your business can make more educated decisions on where to focus improvements.

The bottom line is that improving SDLC responsiveness makes your bosses happy. In this article, you will understand how to use Grafana monitoring to improve DORA metrics, thus enhancing SDLC performance and providing better value for your business and users.

Background

Observability is the ability to obtain insight into the state of applications, hosts, or entire platforms, which is typically implemented via standard methods such as logging, tracing, and monitoring. Observability tools are essential for site reliability engineering (SRE) because they can detect problems quickly to guide response teams. These tools are also crucial components in assessing and reducing cloud costs.

Grafana is a general-purpose time-series visualization tool with the initial use case of monitoring application metrics such as CPU, RAM, disk, and network usage. It originated at Orbitz as a modification of the Kibana dashboard and later spun off into its own company. It back-ends to many database types, but we will focus on Prometheus in this article.

DevOps Research and Assessment (DORA) is a long-running research program at Google. In its State of DevOps report in 2016, Google defined four key metrics used for evaluating the performance of DevOps practices and teams. DevOps units can prove their business value by collecting and striving to improve these metrics.

Summary of key Grafana Kubernetes dashboard concepts

Key concept Description
Software development lifecycle (SDLC) The distinct stages that software goes through to ensure high quality and responsiveness to business needs
DevOps Research and Assessment (DORA) metrics Metrics that summarize the responsiveness of your SLDC practices
Observability Measurement of the performance and reliability of an application and platform
Grafana An observability tool providing dashboards that visualize the resource usage of your Kubernetes clusters and applications, which are critical in key moments of the SDLC

Explanations

The software development lifecycle (SDLC)

The SDLC encompasses all the processes involved in creating business value through software. The lifecycle comprises six general, circular stages, which repeat: Analysis → Design → Development → Testing → Deployment → Maintenance.

The software development lifecycle (source)

In practice, each step is not sequential, especially if using an agile approach, but each software feature will go through all stages. The faster each stage goes, the faster business value is delivered.

Comprehensive Kubernetes cost monitoring & optimization

DORA metrics

This set of four metrics describes the performance of your SDLC practices:

  • Deployment frequency: How often your applications deploy to production
  • Lead time for changes: How long it takes to get app updates to production
  • Change failure rate: The percentage of failed deployments relative to successful ones
  • Time to restore service: How quickly you can resolve issues in production

The four DORA metrics (source)

These metrics are essential to your business because they can help identify possible improvements to your team or organization’s practices. Such improvements typically involve adjusting spending, such as hiring more people, purchasing new tools, or seeking to adjust cloud resource spending. Here are some examples:

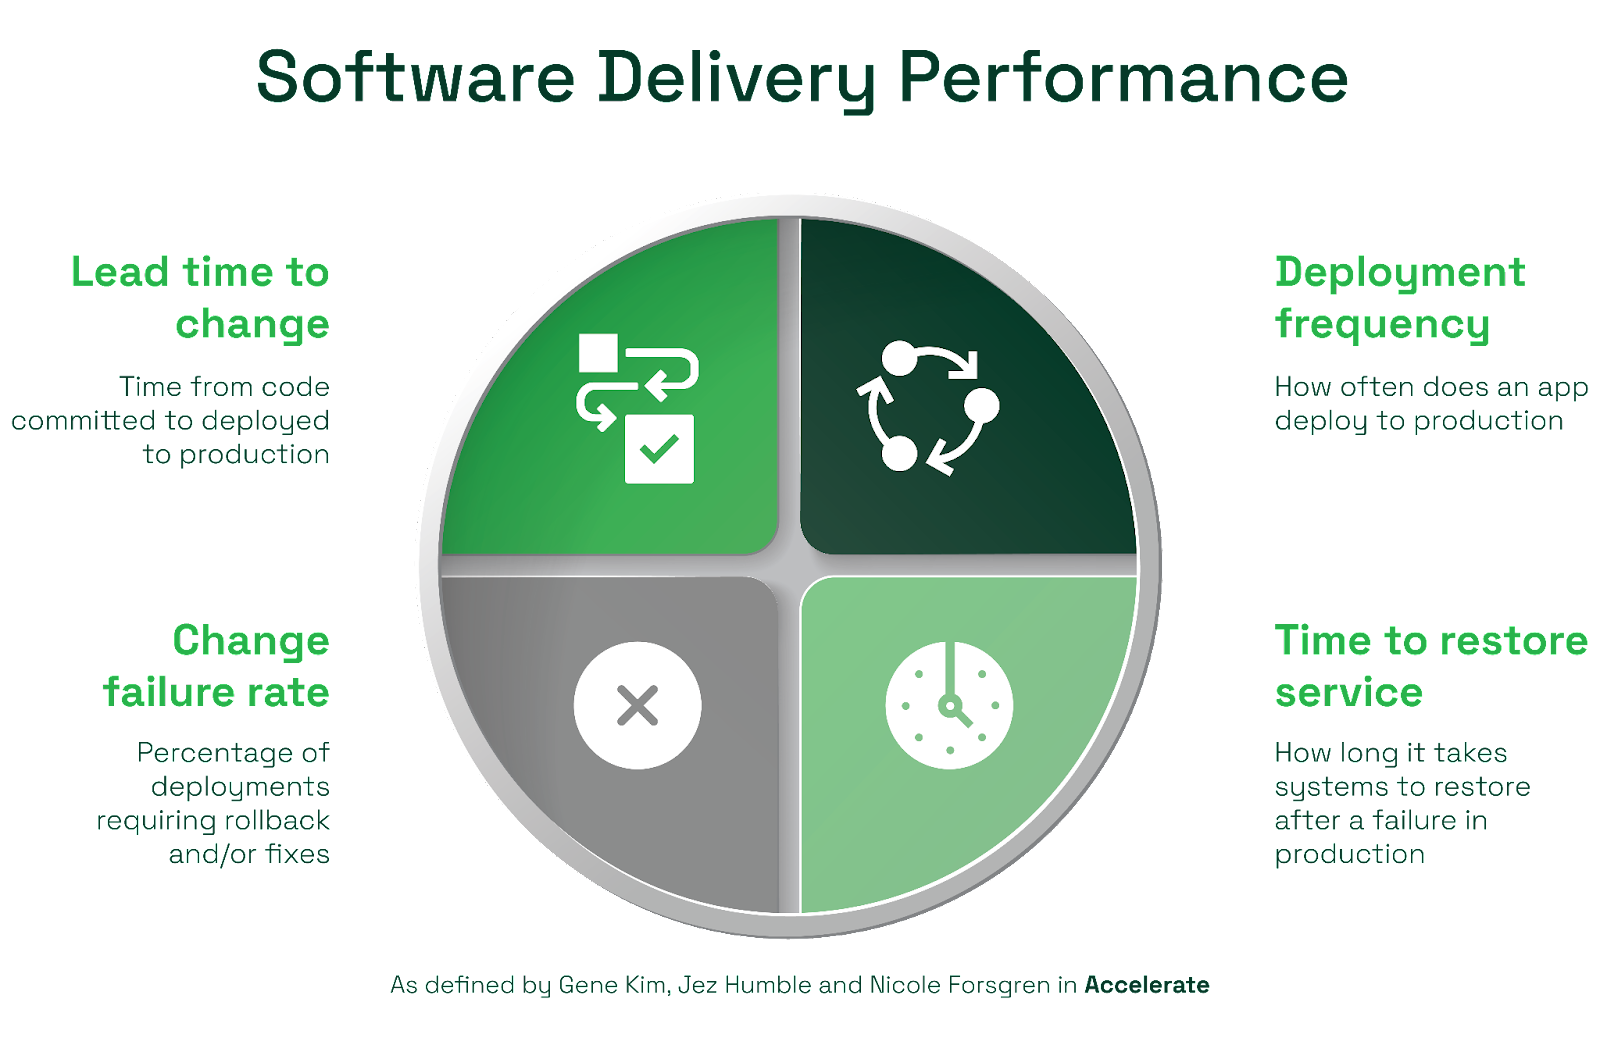
  • If the deployment frequency is low, developers might receive friction when gathering requirements. You can improve this by strengthening communication channels among teams (such as using Slack instead of email).
  • If the lead time for changes is high, your delivery process may be slow because changes might be getting sluggish or stagnant due to overly complex or manual processes. You can improve this by spending engineering time on accelerating with a continuous delivery (CD) system or by optimizing your current processes.
  • If the change failure rate is high, you may need more testing. Slow down feature development to include time for better testing. Fast delivery doesn’t mean much if what you produce is brittle or doesn’t work.
  • If the time to restore service number is high, your software or infrastructure might have performance issues. You can put systems in place to keep a paper trail when things go wrong, such as storing logs, performance monitoring, debugging, etc.

Looking beyond SDLC, improving DORA metrics improves software reliability, providing the features and availability the customer expects.

Kubernetes mechanisms

Liveness probes. Readiness probes. Resource limits and requests. While these are only a minor aspect of this article, please, please, please use them. They are critical tools that Kubernetes uses to manage pods.

Liveness and readiness probes tell Kubernetes what to do if your app becomes unhealthy. Readiness probes tell Kubernetes that the app is ready to receive traffic and are also used to help with a safe rollout. Pro tip: As a rule of thumb, set the time of your liveness probes to twice the time of your readiness probes.

Kubernetes uses many factors to determine which nodes to place pods on. For your workload, the most significant factors are the resource limits and requests you define for your pods. If not set up correctly, your app may not get all the resources it needs, may unintentionally take resources away from other applications, or might not get scheduled at all.

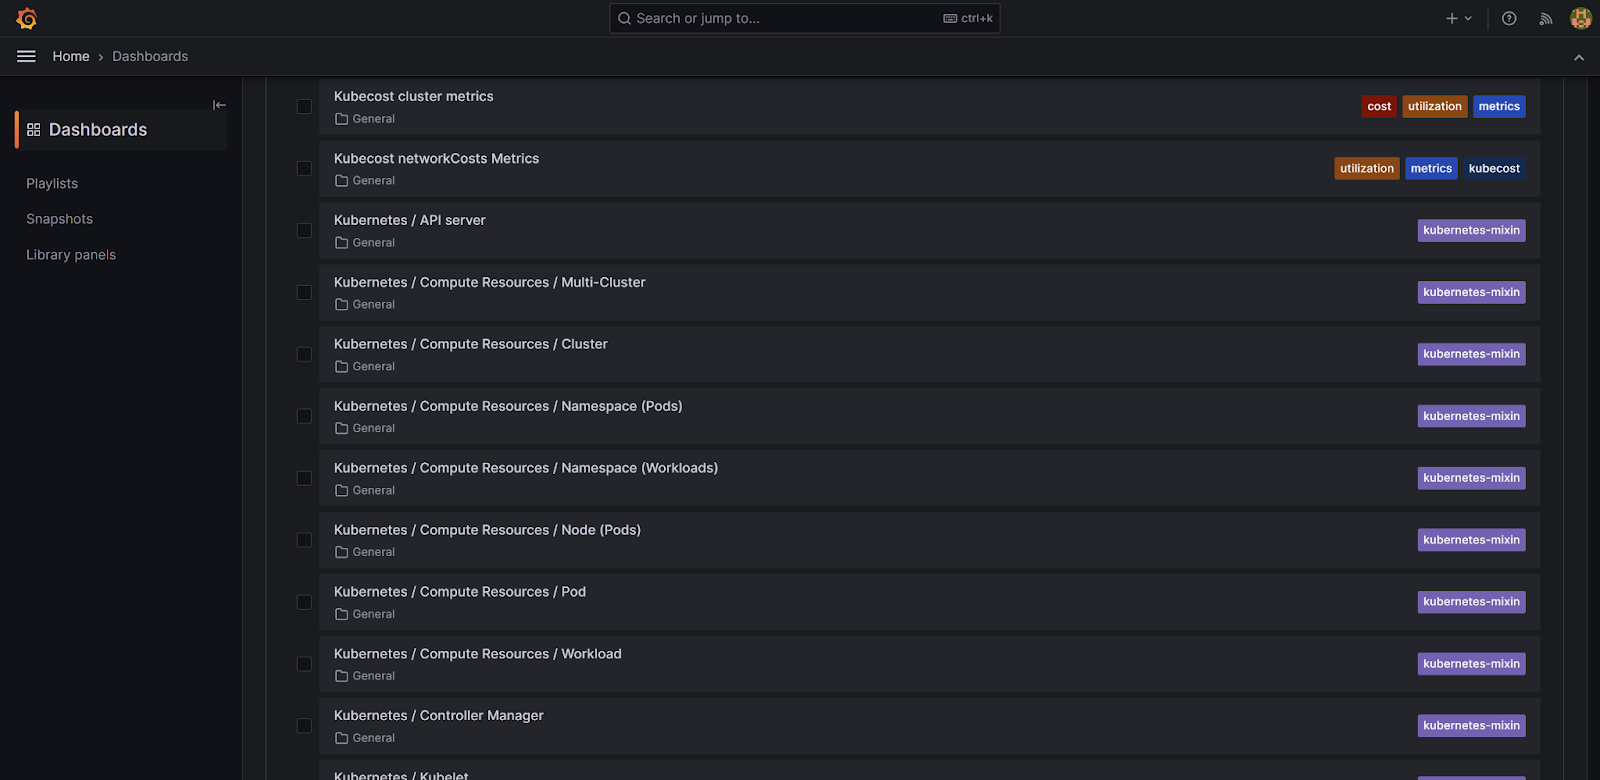
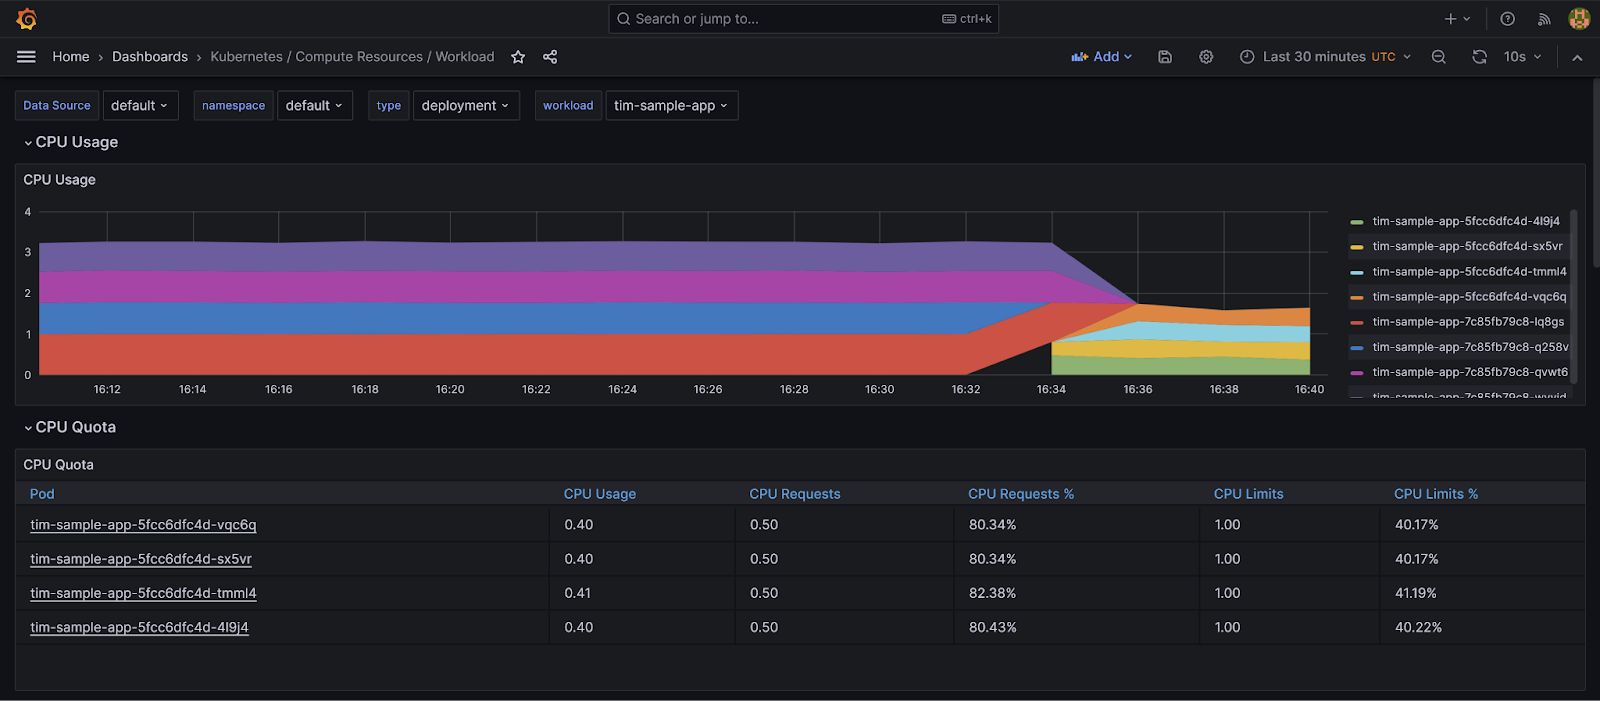
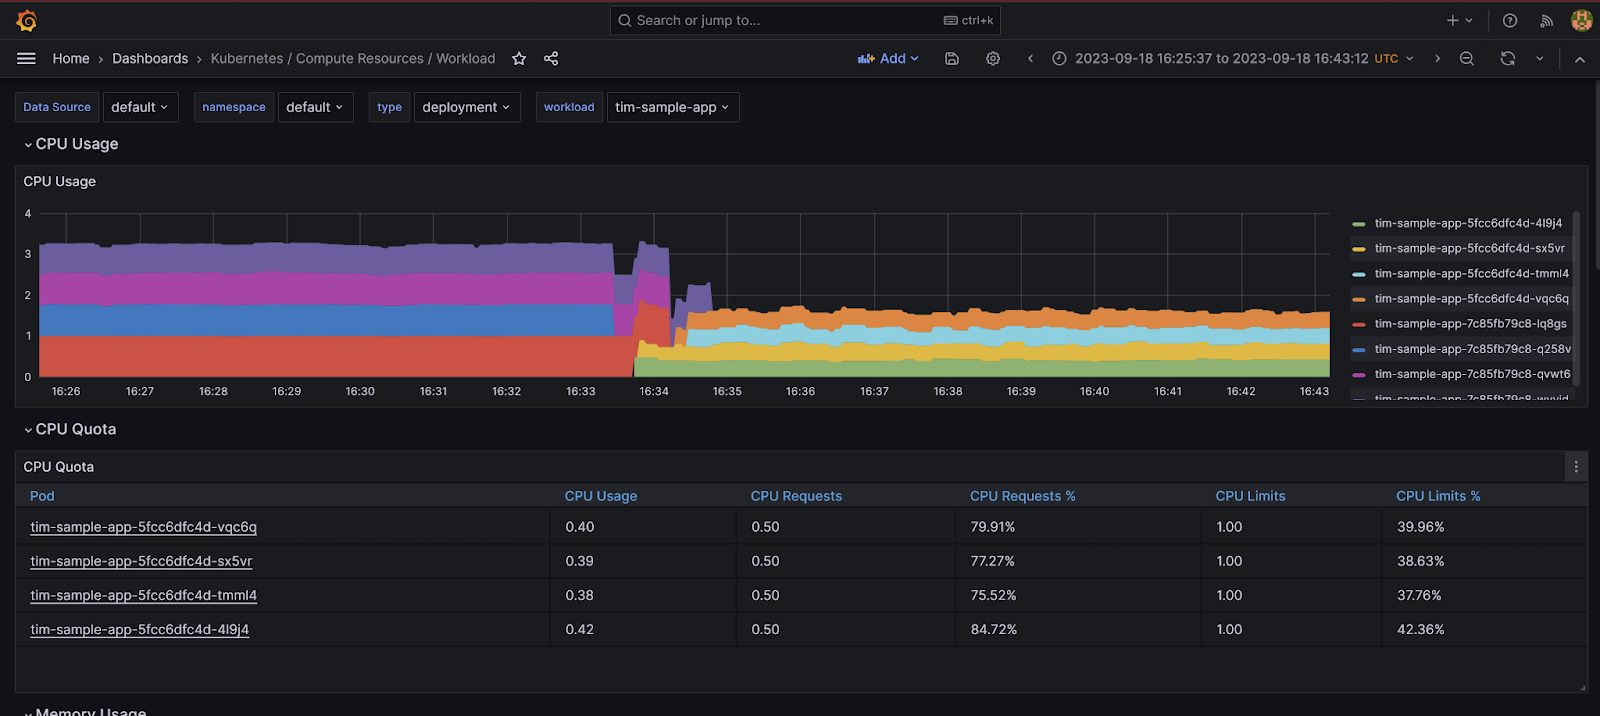
Grafana monitoring dashboards

The monitoring dashboards are crucial when trying to improve your DORA metrics. These dashboards provide valuable metrics, such as CPU and memory, for the whole cluster, nodes, namespaces, workloads, and pods, as well as performance metrics for other Kubernetes resources, such as the API server.

Grafana in practice

In 2016, AT&T began adopting Kubernetes. The Elasticsearch team was tasked with deploying the Elastic stack inside Kubernetes as the logging system for every cluster.

Early in the project, it was reported that Elasticsearch ran for about a day and then crashed every five minutes continually. The team was puzzled because they had never seen behavior like this in their non-Kubernetes environments.

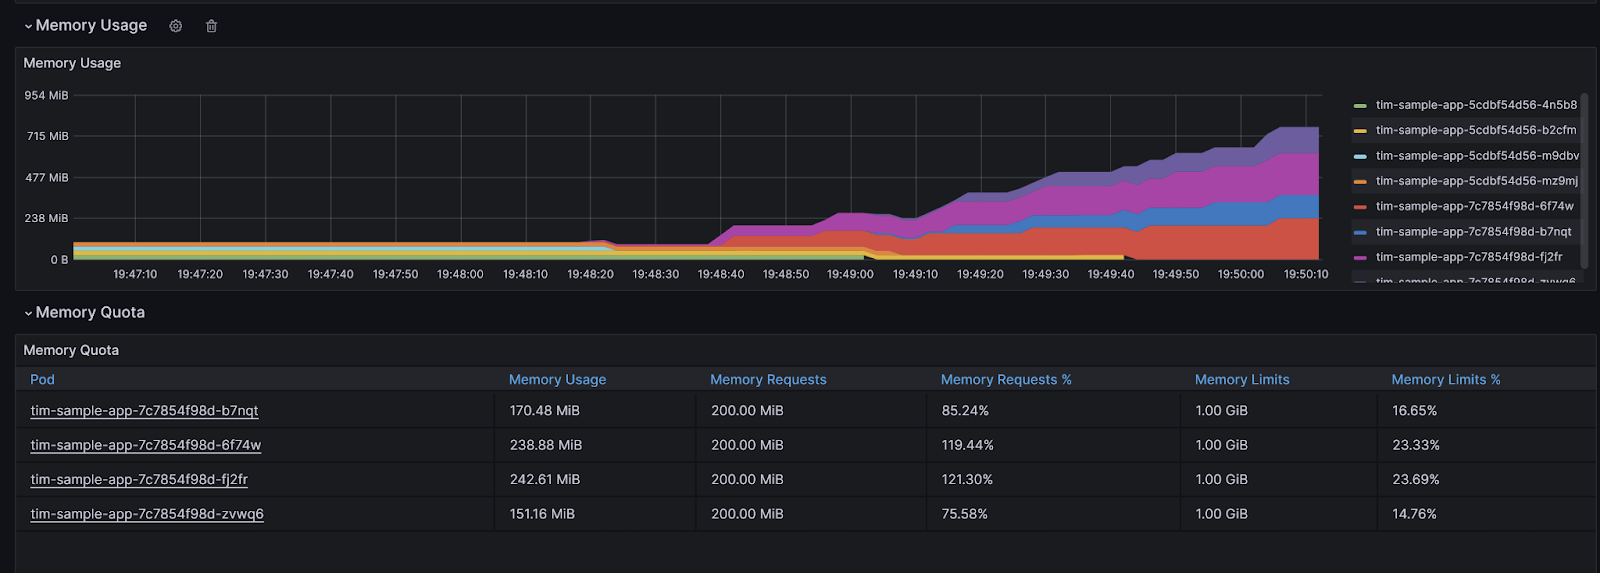
Looking at Grafana, they could see that it was slowly increasing its memory usage over about 24 hours, then hitting the memory limit and crashing. It then loaded back up but quickly ramped up again to the memory limit and crashed, doing so repeatedly. Deleting the pod worked, but eventually, another one would do the same thing.

It took them a few months to get to the bottom of the issue, which was complicated and complex to resolve. The Grafana dashboard provided a starting point for understanding the nature of the issue and became the anchor for its resolution.

Grafana Kubernetes dashboard tutorial

Quick install of Grafana monitoring

Deploying the kube-prometheus-stack Helm chart is relatively simple. Start by adding the prometheus-community helm repo:

helm repo add prometheus-community https://prometheus-community.github.io/helm-charts

helm repo update

It is recommended that you review the values file for the chart.

helm show values prometheus-community/kube-prometheus-stack

As of this writing, you may need to add some workarounds in the file. The below example values file does the following:

  1. Works around a deployment bug in the chart by explicitly setting the scrape and evaluation intervals.
  2. Specifies the use of a PersistentVolumeClaim for storage and defines the size.
  3. Sets the Grafana password.
  4. Set up an Ingress (optional); just uncomment if you want to use it.
prometheus:
  prometheusSpec:

    # bug workaround - https://github.com/prometheus-operator/prometheus-operator/issues/5197#issuecomment-1598421254
    scrapeInterval: "15s"
    evaluationInterval: "30s"

    storageSpec:
      volumeClaimTemplate:
        spec:
          accessModes: ["ReadWriteOnce"]
          resources:
            requests:
              storage: 10Gi
grafana:
  adminPassword: CHANGE-ME!
#  ingress:
#    enabled: true
#    hosts:
#    - monitoring.kube.example

You can then use the following command to create a Namespace and deploy the stack:

kubectl create ns monitoring

helm install monitoring prometheus-community/kube-prometheus-stack -n monitoring --values monitoring-values.yaml
K8s clusters handling 10B daily API calls use Kubecost

The stack will take a few minutes to deploy. You can use this command to check on the status:

kubectl --namespace monitoring get pods -l "release=monitoring"

You can expose Grafana locally using the following command:

kubectl port-forward service/monitoring-grafana -n monitoring 8080:80

Then browse to http://localhost:8080

Alternatively, you can navigate to that URL if you set up an Ingress.

Once there, you are presented with the Grafana login page, where you can log in with the user “admin” and your password.

Grafana dashboards

To find the Grafana dashboards, click on the menu (☰) at the top left, then click on Dashboards.

Grafana presents you with a large set of dashboards:

As you can see, there are many dashboards present. You will notice that the Kubecost dashboards are installed. They help calculate the cost of your cluster and application resources.

We will focus on the Kubernetes / Compute Resources dashboards, which allow you to monitor the performance at many levels: the entire cluster, individual nodes, namespaces, workloads, pods, and containers. The Workload dashboard is especially helpful as it allows you to view the performance of all pods within a workload, such as Deployments, StatefulSets, and more.

Here is an example of the Grafana dashboard visualizing the performance of a sample app during the rollout of a new version that improved CPU performance. It is awesome because you can immediately see the impact of the improvement.

CPU performance of an application before and after a new release rollout.

Customization

You don’t need to stay with the defaults; these dashboards are intended to be customized. For example, modifying the query interval will give graphs finer detail. To do this, follow these steps:

  1. Click the three bullets at the top right of a graph and click Edit (it shows up when you hover over the graph).
  1. Click Query options and adjust the minimum interval. For the finest detail, set it to 1s:

With those modifications, the previous rollout graph now looks like this:

One-second interval clarity of Kubernetes performing a progressive deployment rollout.

Look at that beautiful detail. Not only can you see finer detail on the CPU usage of each pod, but you can also see how Kubernetes maintained the RollingUpdateStrategy of pods during the rollout.

Learn how to manage K8s costs via the Kubecost APIs

Using Grafana to improve DORA metrics

Grafana monitoring has a substantial impact on improving DORA metrics. Directly, it impacts change failure rate and mean time to recover in production; indirectly, it improves deployment frequency and lead time for changes when Grafana is used in non-production environments.

Change failure rate

By watching Grafana when you deploy an application update, you can quickly tell if things are going wrong. It’s essential to monitor all metrics during a rollout: CPU, memory, networking, and disk usage. The Namespace dashboard is helpful during a multi-component rollout. The Workload dashboard is useful to look at a specific set of pods.

For example, below is a graph of deploying a new version of an application that has a nasty memory leak.

Memory usage of pods for an application deployment where the new version has a bad memory leak

As you can see, this release gets past the liveness and readiness probes, so Kubernetes doesn’t take immediate action. Eventually, however, the app will reach its memory limit and crash with an OOMKilled out-of-memory error.

Because these failures happen on a rollout, it is usually easy to narrow them down to a particular application component that has recently been updated and then investigate. At this point, the most common treatment is to roll back and try to reproduce the issue in a test environment. This will help inform what changes to make and what new tests can be added.

Mean time to restore

Errors may also happen at random times outside of deployment. Alerting is paramount as it can send notifications when action needs to be taken. Once an alert is received, you can use Grafana to review the alerting metric and begin your investigation. Errors like these are usually difficult to resolve because seeing the level at which things break is not immediately apparent. Is it code? Is it the node? Is it networking? It’s like finding a needle in a haystack.

Here is an example of a pod that suddenly stopped responding to requests.

A pod that stopped responding to requests. Kubernetes quickly detected it and restarted the app.

As you can see, the network traffic for that pod dropped to zero. Kubernetes does step in and balance the load across the other three pods—which is pretty cool—but the issue still warrants investigation.

Although that scenario is simple, sometimes finding the root cause can be complex. When troubleshooting, start at the highest level and work to lower levels systematically. Using the Grafana Kubernetes / Compute Resources dashboards, you might go in the following order: cluster, node, namespace, workload, and then pod. Some troubleshooting techniques you could use are exec’ing into a pod, deploying a pod with a complete toolset, or cordoning off a node and migrating pods. It may be helpful to attach a remote debugger in non-production environments.

The quicker issues are resolved, the lower your mean time to restore.

Deployment frequency and lead time for changes

These two metrics assess the SDLC performance of your software development pipeline, from writing code to delivering in production. They improve by catching deployment and performance issues in development and testing. Detecting problems as soon as they happen speeds up the delivery pipeline and ensures more stable deployments.

The Grafana monitoring during rollout and break/fix we discussed above now become part of your delivery pipeline to catch issues early. After all, this is what DevOps is all about, ensuring that you handle how software is developed and run.

Next steps

After installing Grafana, take additional steps to improve your SDLC performance.

  • Add alerting: Issues happen in the middle of the night, so you want to prepare. Alerting is paramount to ensuring a fast response. Thankfully, the kube-prometheus-stack Helm chart bundles in Alertmanager, which is easy to configure.
  • Add observability: Some examples are logs, networking topology, and distributed tracing. A favorite logging system is Elastic Stack. If you’re using Istio, Jaeger is suitable for tracing and Kiali for topology.

The Kubecost dashboard on a homelab

  • Reduce costs. Of course, everyone wants to reduce cloud spending, but knowing where to start is better than guessing. Kubecost allows you to quickly view all aspects of cost for the cluster, namespaces, workloads, and pods. With this information, you can make an educated decision about how to reduce spending. Some examples include choosing a less expensive node type to maximize compute resource utilization or improving an app’s performance to use less CPU.

Limitations

The dashboards that ship with kube-prometheus-stack are insufficient for directly observing the Four Golden Signals. These are application-level metrics. You should use tools that monitor calls at the application level, such as a tracing tool like Jaeger.

Once past the POC stage with the Helm chart, please use a more custom approach to deploying Prometheus and Grafana for regular use. Remember that it is best to deploy the monitoring stack outside of what you are monitoring (your cluster).

Best practices

Here are some best practices to keep in mind:

  • Periodically review and edit your dashboards. These stock dashboards are really just building blocks. It’s important to customize them or even make new ones to match your application and business needs.
  • Manage your dashboard configurations just like your code with version control systems like git. You will want not only a saved working copy of your dashboards but also the safety of being able to revert. This also simplifies promoting the same dashboards to all your environments.
  • Manage cloud spending with Kubecost. Kubecost adds Grafana dashboards that help estimate the cost of your applications and infrastructure. How powerful would it be to be able to prove your delivery performance with DORA metrics and follow up with a cloud spend estimate and forecast?

Conclusion

In this article, we deployed Grafana on Kubernetes and explored its dashboards, providing immediate insights into application and platform stability. We learned how to use these dashboards in crucial moments of the SDLC from development to production, enabling us to measure DevOps maturity with DORA metrics.

With these SDLC metrics and infrastructure costs, you can empirically show the performance and value of your organization. These insights can help guide business decisions and improve sentiment toward your organization.

Comprehensive Kubernetes cost monitoring & optimization

Continue reading this series