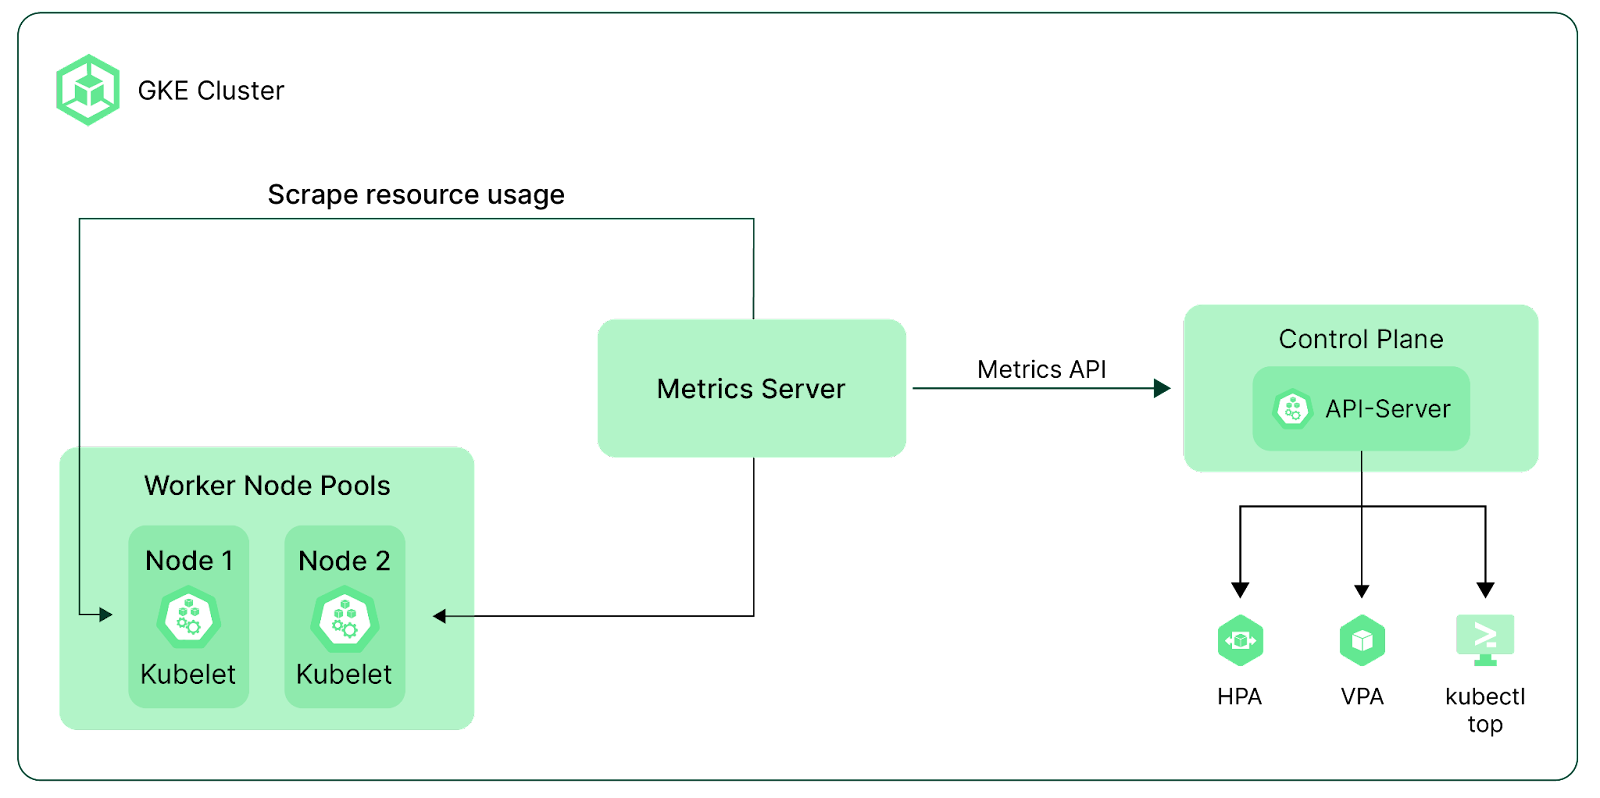
System metrics
System metrics related to memory, storage, CPU, Network throughout, etc., are forwarded to Cloud Monitoring by default in GKE Standard and Autopilot clusters. These metrics are captured at the container, pod, and node levels and have the prefix kubernetes.io/. You can find the complete list of available system metrics here.
During cluster creation or later, you can enable additional observability options in your GKE cluster, such as Control plane Metrics and Kube State Metrics.
Control plane metrics
Control plane metrics enable health monitoring for Kubernetes components by collecting metrics for the Control Plane components, such as the Kubernetes API server, Scheduler, and Controller Manager.
How to use the Cloud Shell with GKE
You can use the steps in this Google Cloud Docs page to activate the Cloud Shell, a built-in shell that interacts with Google Cloud resources. Once the Cloud Shell is activated, you can follow the below steps to enable Control Plane metrics:
Note: Please replace the variables($CLUSTER_NAME, $REGION, $ZONE) in the commands below with your values.
Step 1: You can get all the information about the GKE cluster using the following command:
gcloud container clusters describe $CLUSTER_NAME --region=$REGION
Step 2: Download the cluster kubeconfig to your local workstation. The following command generates the kubeconfig and adds it to the ~/.kube/config file.
gcloud container clusters get-credentials $CLUSTER_NAME \ --region=$REGION
Step 3: Run the below command to enable the Control Plane Metrics:
gcloud container clusters update $CLUSTER_ID \
  --zone=$ZONE \
  --project=$PROJECT_ID \
  --monitoring=SYSTEM,API_SERVER,SCHEDULER,CONTROLLER_MANAGER
Kube state metrics
Kube state metrics is an open-source project that you can install on a Kubernetes cluster, and it exposes various cluster metrics in the Prometheus format. GKE comes with a pre-packaged Kube State Metrics installation, which users don't need to manage. But you can install your open-source version, bringing your copy of the software to tweak custom parameters. It helps you monitor the health of Kubernetes objects such as deployments, nodes, and pods.
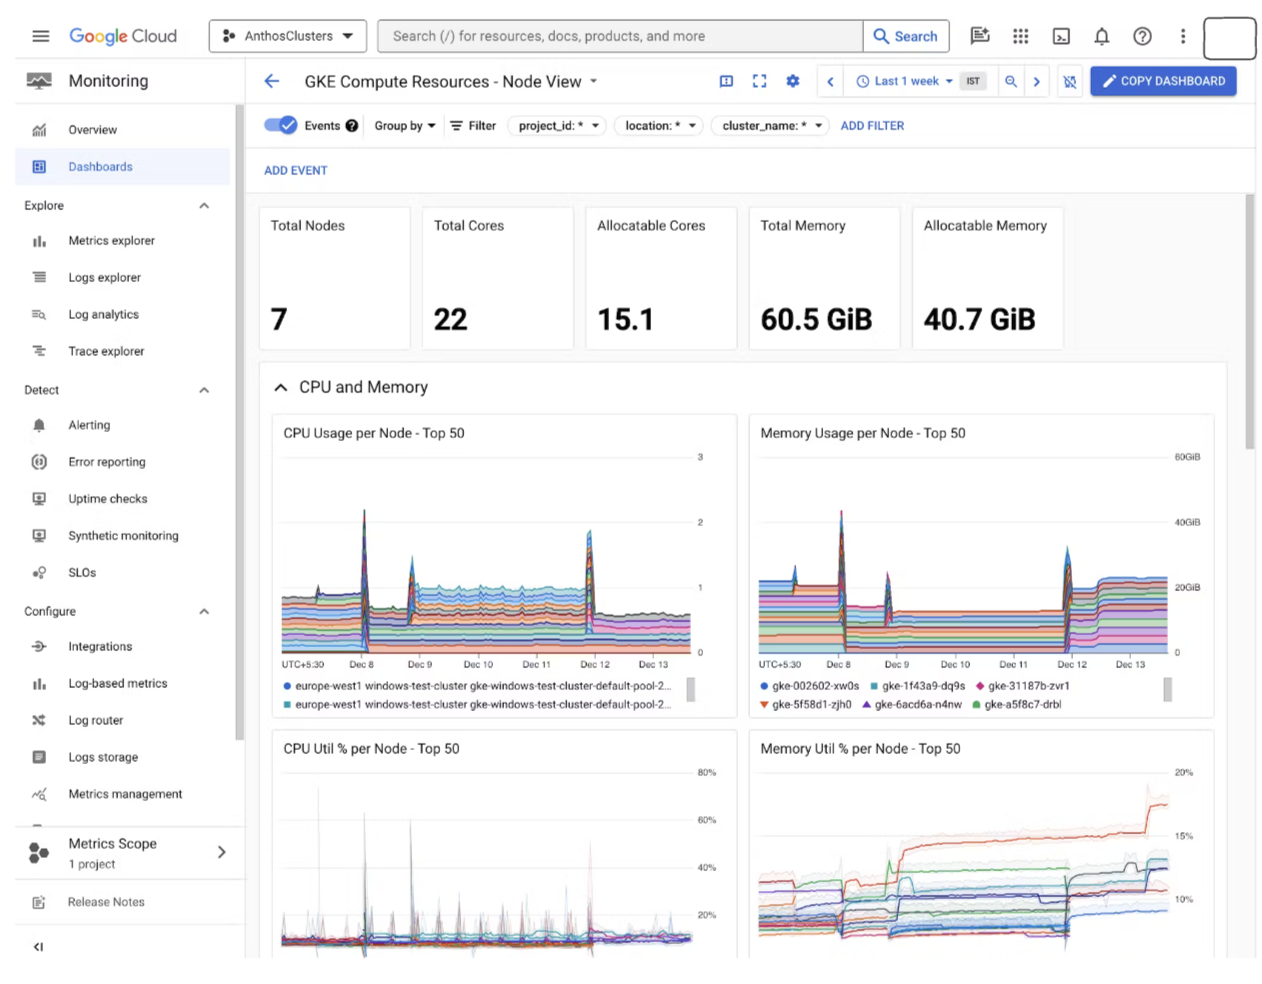
Benefits of collecting GKE metrics
Keeping track of metrics can help identify and solve issues in GKE clusters. These issues include high CPU or memory usage, which may show the possibility of memory leaks in the application or insufficient resources assigned at the container or node level.
Collecting GKE metrics could mitigate many critical issues during the initial phase. For instance:
- High container restarts could indicate that containers are crashing. A high number of unscheduled pods may indicate the cluster needs more resources or they have configuration errors.
- High ingestion rates for Cloud Logging or Google Cloud Managed Service for Prometheus can also increase Google Cloud operation suite costs. This can be reduced by decreasing ingestion rates and proactive monitoring of the ingested data.
By tracking resource usage in GKE, you can ensure you are using Kubernetes resources effectively. Monitoring GKE resources can help identify their real-time status and ensure optimal availability, preventing service outages.
With the right alerts, you can quickly take action if something is about to or does go wrong, preventing minor issues from becoming more significant problems. Monitoring can also help you identify the root cause of a problem, making it easier for Kubernetes administrators to find the issue quickly and reduce recovery times.
Finally, monitoring GKE supports thorough cost optimization, allowing you to maximize your returns on GKE investment by identifying which resources to cut, keep, and increase.