Learn how to monitor Kubernetes performance for system health, optimization, capacity planning, and troubleshooting cluster issues.

Kubernetes Performance Monitoring

Kubernetes has transformed how organizations deploy and scale applications. As organizations increasingly adopt Kubernetes, understanding the details of its performance aspects becomes essential.

This article explores a few different areas of Kubernetes performance monitoring. We first discuss why monitoring is important and what to monitor in a Kubernetes cluster. We then look at a few tools available in the monitoring space, some general best practices, and common issues and potential solutions. We wrap up by looking at some AI tools and techniques.

The article assumes that you are already familiar with Kubernetes's core concepts. Please refer to our guidelines page to learn more about Kubernetes guidelines and best practices.

Dive in to fortify your Kubernetes monitoring strategy and derive the maximum value from your cluster.

Summary of key Kubernetes performance monitoring concepts and best practices

The table below summarizes the key concepts and best practices of Kubernetes performance monitoring.

Concept / best practice Description
Why Kubernetes performance monitoring is essential Monitoring Kubernetes system health is necessary to ensure system health, resource optimization, adequate capacity planning, cost management, and efficient troubleshooting.
Key metrics in Kubernetes monitoring Essential metrics in Kubernetes include node, pod, network, disk, and API server metrics.
Tools for Kubernetes performance monitoring Some of the popular open-source and commercial tools for monitoring are Prometheus, Grafana, cAdvisor, the ELK stack, Kubecost, and Jaeger.
Best practices for Kubernetes performance monitoring Best practices include granular monitoring, setting up alerts, performance baselines, CI/CD integration, load testing, and regular review and adjustment.
Common performance issues and solutions Resource starvation, network latency, API server overload, inadequate monitoring configuration, and bottlenecks are some of the common performance issues.
AI-powered Kubernetes monitoring Integrating AI in monitoring can enhance anomaly detection, prediction, and root cause analysis.

Why Kubernetes performance monitoring is essential

Kubernetes, the de facto standard for container orchestration, is at the heart of many modern, scalable, and resilient applications. But with great power comes great responsibility—ensuring that Kubernetes-based applications perform optimally. Let's dive into why Kubernetes performance monitoring is essential:

  • System health: Monitoring ensures that Kubernetes components are up and running and performing as expected. A healthy Kubernetes system translates to smooth application performance, improving user experiences and system reliability.
  • Resource optimization: Performance monitoring helps with identifying inefficiencies that can lead to unnecessary cost and wasted capacity by analyzing metrics like CPU use, memory usage, and network throughput.
  • Capacity planning: Performance monitoring provides insights into workload patterns and resource utilization trends. This data is key for capacity planning, helping predict future resource requirements and make well-informed decisions about scaling up or down.
  • Better cost management: By monitoring resource utilization and performance metrics, organizations can avoid overprovisioning and wasting money on resources that are never used. This leads to significant cost savings, especially in cloud-based Kubernetes environments where resource usage directly impacts the budget.
  • Troubleshooting: Anomalies can quickly be detected by continuously monitoring the system. Effective monitoring enables you to react swiftly, minimizing downtime and ensuring service continuity, whether the issue is a sudden spike in traffic, a failed pod, or a network bottleneck.

Key metrics in Kubernetes monitoring

Monitoring the right metrics provides insight into the health and performance of the Kubernetes environment.

The key metrics are generally provided by one of the following three sources:

  • Kubernetes API server: Typically provides metrics related to the state and status of Kubernetes objects like nodes, pods, deployments, etc.
  • cAdvisor: This tool is integrated in Kubelet and typically provides metrics related to the resource usage (CPU, memory, disk, and network) of nodes and containers.
  • Custom exporters: Prometheus scrapes data from custom exporters to collect custom metrics not exposed by default. These exporters are often provided as part of an application.

Typical sources of metrics in the Kubernetes environment

Now, let's explore the key metrics, categorized by their scope and impact.

Cluster-level metrics

Node availability

This metric is crucial as it indicates the status and availability of the nodes in your cluster. Monitoring node availability helps ensure that there are enough active nodes to support your workloads. Here is an example of a node availability metric:

  • Kube_node_status_condition: This metric is obtained from the Kubernetes API server and indicates the condition of a node (Ready, OutOfDisk, MemoryPressure, etc.).

Resource usage

Keep a close eye on CPU, memory, and storage usage across the cluster. These metrics are vital for understanding overall resource demand and ensuring that the cluster is at the right resource level. Here are example metrics that are typically collected from the Kubelet's cAdvisor to provide nodes' resource usage information:

  • node_cpu_usage_seconds_total: Total CPU usage of the node
  • node_memory_MemAvailable_bytes: Available memory in the node
  • node_filesystem_avail_bytes: Available filesystem capacity in the node

Pod-level metrics

Pod status

Monitoring the status of pods (running, pending, failed, etc.) is essential for understanding the health of your applications. It helps in identifying issues like crash loops or scheduling failures. For example:

  • Kube_pod_status_phase: The phase of a pod, sourced from the API server (Pending, Running, Succeeded, Failed, or Unknown).

Pod resource usage

Track the CPU and memory usage of individual pods. This is important for spotting resource-intensive applications and ensuring that pods have the necessary resources to run effectively. Typically, you would use these metrics from cAdvisor:

  • container_cpu_usage_seconds_total: CPU usage by a container
  • container_memory_usage_bytes: Memory usage by a container

Note that the examples above provide container-level resource usage. For pod-level resource usage, you typically aggregate or sum the resource usage of all containers within a given pod.

Comprehensive Kubernetes cost monitoring & optimization

Network metrics

Network throughput

The amount of data being transmitted and received by your cluster is a critical metric. High or unexpected network throughput can indicate issues like misconfigured applications or network-intensive processes. Use these metrics to measure the network traffic for each container:

  • container_network_receive_bytes_total: Total bytes received by a container
  • container_network_transmit_bytes_total: Total bytes transmitted by a container

Network errors

Errors such as dropped packets and connection timeouts can severely impact application performance. Here are some example metrics:

  • container_network_receive_errors_total: Total receive errors on the container network interface
  • container_network_transmit_errors_total: Total transmit errors on the container network interface

Both network throughput and error metrics can be collected from cAdvisor, which monitors the network usage of containers.

Disk metrics

Disk I/O

Monitor your storage devices' read/write speeds, which are typically collected from cAdvisor. Slow disk I/O can be a bottleneck for applications that rely heavily on disk operations. Examples:

  • container_fs_reads_bytes_total: Total bytes read by a container
  • container_fs_writes_bytes_total: Total bytes written by a container

Disk capacity

Monitor the used and available storage capacity, which, again, are typically collected from cAdvisor. Running out of disk space can lead to application failures and should be proactively managed. Examples:

  • node_filesystem_size_bytes: Total size of the filesystem
  • node_filesystem_free_bytes: Free disk space

API server metrics

It is a good practice to monitor the performance of the API server itself to ensure that it is not overloaded and that it works appropriately. The API server provides its own metrics.

Request rates

High request rates indicate a busy cluster and might require scaling. Example metric:

  • apiserver_request_total: Counter of requests made to the Kubernetes API server

Request latency

High latencies can lead to slow application performance and should be investigated. Example metric:

  • apiserver_request_duration_seconds: Histogram of the duration of requests to the API server

Application-level metrics

These metrics are specific to the application itself and can vary widely depending on the nature of the application. It's often necessary to rely on instrumentation within the application code to collect and monitor these application-specific metrics in a Kubernetes environment. Tools can scrape these metrics if the application exposes them in a format that tools understand (like a /metrics HTTP endpoint).

Here are some common application metrics you might monitor in a Kubernetes environment:

  • Application throughput: Measure the number of transactions or requests an application processes over a certain period, like the total number of orders processed in an ecommerce application.
  • Response time: Capture the application's time to respond to a request, like the time for a database query execution.
  • Error rate: Capture the frequency of errors in the application, such as the number of errors that occurred during payment processing.
  • Saturation: Measure how “full” your service is, based on measurements like queue length or session count, indicating how much load the application can handle before it degrades.
  • Business-specific metrics: This includes any other custom metrics directly tied to the business objectives of the application, such as the number of new user signups, user engagement metrics, fraud transactions in a bank, etc.

Remember, while infrastructure metrics give you a view of the health and performance of the underlying system, application metrics provide insights into how well the application functions from an end-user perspective. Both are crucial for understanding your system's performance in Kubernetes.

For a comprehensive list of the infrastructure metrics, you can check the Kubernetes documentation.

Tools for Kubernetes performance monitoring

To monitor the performance of a Kubernetes cluster effectively, it's crucial to have the right tools in your arsenal. These tools can help you gather, analyze, visualize, and manage the metrics and logs that are vital for understanding and optimizing your Kubernetes environment.

Here's a look at some of the critical tools widely used in the industry for Kubernetes performance monitoring.

Prometheus

Prometheus stands out for its powerful data modeling, query language, and alerting features. It's a go-to tool for gathering time-series data from Kubernetes components. Prometheus is particularly good at capturing real-time metrics, offering a robust query language (PromQL) for data analysis and alert generation.

Grafana

While Prometheus excels at data collection, Grafana is the tool of choice for visualization. It integrates seamlessly with Prometheus, allowing you to create comprehensive, easy-to-understand dashboards. Grafana's strength lies in its ability to present complex data in a visually appealing and interpretable format, which makes it easier for teams to make informed decisions.

cAdvisor

Container Advisor (cAdvisor) is built into Kubelet to provide native support for monitoring container metrics. It offers detailed information about resource usage and the performance characteristics of running containers. This tool is handy for those who need in-depth insights into the container ecosystem in Kubernetes.

Combining Prometheus, Grafana, and cAdvisor

These three tools integrate to deliver a complete flow that collects, aggregates, stores, and visualizes metrics, as described in this diagram:

Metrics collection, storing, and visualization flow

K8s clusters handling 10B daily API calls use Kubecost

The Elasticsearch, Logstash, Kibana (ELK) stack

Elasticsearch provides a distributed search and analytics engine. Logstash is a log pipeline tool that can process data from different sources and send it to Elasticsearch. Finally, Kibana lets you visualize the data stored in Elasticsearch. Combined, they form the ELK stack, a powerful tool for handling Kubernetes logs. This stack is essential for anyone looking to delve deep into Kubernetes logging and perform complex searches and analyses.

ELK stack simple flow

Kubecost

Kubecost is used for cost monitoring and management in Kubernetes environments. It provides real-time visibility into how much resources cost and identifies areas to optimize spending. Kubecost offers features like cost allocation, budget alerts, and efficiency recommendations. It can help pinpoint unnecessary resource usage and provide insights on how to scale resources effectively without overspending.

Jaeger

Jaeger is invaluable for tracing and monitoring microservices-based architectures. It helps track a request's time to traverse the various services in a Kubernetes cluster. This is crucial for identifying latency issues and optimizing the overall performance of microservices.

Best practices

Effective Kubernetes performance monitoring requires the right tools and adopting a set of best practices that ensure their effective use. Let's explore some essential techniques to help you maintain a robust and efficient Kubernetes environment.

Employ granular monitoring

When it comes to monitoring, one size does not fit all. It's crucial to monitor both the macro level (the entire cluster) and the micro level (individual pods and containers). This granularity lets you capture a comprehensive view of your environment, ensuring that no aspect of the system's performance is overlooked.

In addition to detailed monitoring, integrating observability into your Kubernetes strategy is crucial. While monitoring focuses on the known metrics and logs, observability extends to understanding the system's overall state, including tracing and tracking unknown issues as they arise. Observability complements traditional monitoring by providing context and insight into how different parts of your Kubernetes environment interact and affect performance.

This combination lets users capture metrics and logs and explore, analyze, and understand the deeper “why” behind performance issues, leading to more effective problem-solving and optimization.

Set up alerts

Proactive monitoring involves setting up alerting mechanisms for potential issues. This ensures that you are notified of any anomalies or performance degradations, allowing quick responses to potential issues before they escalate into major problems.

Tailor your alerts to be meaningful and actionable to avoid alert fatigue. For example, you can set alerts for when CPU or memory usage exceeds a certain threshold for a specified duration. Shown below is a Prometheus query to trigger an alert if CPU usage goes above 80% for more than 10 minutes.

avg_over_time(kube_pod_container_resource_requests_cpu_cores[10m]) > 0.80

You can configure alerts to trigger in other conditions, such as:

  • When disk utilization reaches a high percentage of total capacity, to prevent issues related to disk space exhaustion
  • A Kubernetes node going down or being in a NotReady state
  • Having a significant number of pods being in the CrashLoopBackOff state
  • Experiencing unusually high network latency
  • Seeing a sudden drop in custom application metrics, e.g., transaction volume

When setting up these alerts, it's important to

  • Define clear thresholds that are indicative of a problem.
  • Only set up actionable alerts to prevent overwhelming teams with meaningless notifications (alert fatigue).
  • Regularly review and adjust alerts as your system changes.

Establish and maintain a performance baseline

Having a performance baseline involves understanding your system's normal behavior and performance metrics under typical loads. This baseline allows you to spot anomalies or performance issues that deviate from the norm more easily.

Here are some detailed steps for doing this:

  1. Start with comprehensive data collection: Initially, monitor and record metrics from all critical aspects of your system over a period of time. This includes cluster-level, pod-level, and application-specific metrics. Consider different load scenarios at this stage and gather data under various conditions, including normal, peak, and low usage periods to help understand how the system behaves under different circumstances.
  2. Determine relevant metrics: Identify the most relevant metrics for assessing your system's health and performance. These could be CPU and memory usage, response times, error rates, etc.
  3. Set thresholds for KPIs: For each of the identified metrics above, establish a normal range. This might vary depending on the time of day, day of the week, or other factors specific to your application's usage patterns. This is your Kubernetes cluster performance baseline.
  4. Regularly review and update the baseline: The baseline is not static, so regularly review it because system performance can change over time due to updates in applications, changes in usage patterns, or infrastructure modifications. Update the baseline to reflect new norms in the context of these recent changes.

Keep detailed documentation of the performance baselines and any updates made to them. Also ensure that all relevant team members understand the baseline, how it was established, and how to respond to deviations.

Perform load testing as a proactive measure

Regular load testing helps illustrate how your system behaves under stress and aids in capacity planning. By simulating peak loads, you can identify potential bottlenecks and plan for necessary scaling.

Here are some effective tools for load testing in Kubernetes environments:

  • Apache JMeter: JMeter is a popular open-source tool for performance testing. It can simulate heavy load on servers, networks, or objects to test strength and analyze overall performance under different load types.
  • Locust: Locust is a simple, scriptable, and scalable load-testing tool. Unlike traditional tools that use a GUI, tests are written in Python, which offers great flexibility and the ability to script complex scenarios.
  • K6: k6 is a modern open-source load testing tool designed for developer-centric workflows and primarily used for testing the performance of backend services.
  • Gatling: This is another powerful load testing tool that is known for its high performance.

While load testing, closely monitor system metrics to understand the impact and response of your system under heavy load conditions. Use the insights gained from load testing to iterate and optimize your Kubernetes configurations, ensuring that your system is always tuned for optimal performance.

Regularly review and adjust

Kubernetes environments are dynamic, and what works today might not be optimal tomorrow. You should regularly review and adjust your monitoring strategies, thresholds, and practices to keep up with application and infrastructure changes.

Learn how to manage K8s costs via the Kubecost APIs

Common performance issues and how to address them with monitoring

Even with the best monitoring and practices, Kubernetes environments can still face specific performance issues. Let's explore some of these issues and relevant solutions.

Resource starvation

Problem: Pods running out of resources (CPU, memory) can decrease performance, and when a node runs out of resources, pods may be evicted, leading to service disruption.

Solution: Regularly monitor resource utilization metrics to ensure appropriate resource quota allocation and implement resource limits and requests in your pod configurations accordingly.

Network latency

Problem: High latency can severely impact application performance, especially in distributed architectures.

Solution: Monitor the network for any errors. Additionally, identify bottlenecks by monitoring pod-to-pod latency, service-to-pod latency (for any load-balancing delays), and latency between the ingress controller and the backend services.

API server overload

Problem: An overloaded API server can become a bottleneck, leading to slow response times and general unresponsiveness in the cluster.

Solution: Monitor API server request rates and latency; if necessary, scale your control plane nodes. Also, review and optimize any frequent, unnecessary API calls from applications or operators.

Inadequate monitoring configurations

Problem: Not having the proper monitoring setup can lead to blind spots where performance issues go undetected.

Solution: Review and update your monitoring configurations regularly. Ensure that you monitor all vital metrics and that your alerting system is finely tuned to detect anomalies.

Storage performance and IOPS bottlenecks

Problem: Sometimes the root cause of application performance issues in Kubernetes can be tied back to storage, especially in cloud environments. Lower IOPS can lead to significant latency in applications, particularly those that are I/O intensive.

Solution: Monitor storage performance metrics to ensure that they meet the application's needs. In cloud environments, consider adjusting the storage configuration or provisioning for additional IOPS.

Looking ahead: AI in Kubernetes monitoring

AI stands out for its potential impact on the future of Kubernetes performance monitoring. AI brings a new level of sophistication in detecting anomalies, providing predictive insights, and conducting root cause analysis.

AI-enabled tools ecosystems

Tools like Dynatrace, New Relic, and Datadog have started integrating AI capabilities, offering more intelligent monitoring solutions. Each tool provides out-of-the-box AI functionalities specifically tailored for Kubernetes, enhancing its monitoring through advanced anomaly detection, predictive insights, and efficient root cause analysis. Integrating these tools into your Kubernetes environment can significantly improve the way you monitor and manage the performance and health of your applications and infrastructure.

Dynatrace

Dynatrace offers seamless observability in cloud-native environments with features like automated anomaly detection, performance analysis, and end-to-end transaction tracing, all of which are crucial for dynamic Kubernetes environments.

Dynatrace provides an intelligent platform with multiple modules. One of these modules is Davis AI, which is designed for automatic root cause analysis. It excels in detecting anomalies, correlating them with other events, and identifying the likely cause of issues. Another module is OneAgent, which is used as a monitoring solution to simplify data collection across the entire IT infrastructure, including Kubernetes environments.

New Relic

New Relic's AI component, called New Relic Applied Intelligence, offers automatic anomaly detection, an intelligent grouping of all related warnings and issues (which New Relic calls “noise reduction”) and suggestions of relevant and actionable decisions based on your usage and historical data. It helps reduce time-wasting and enhances focus on critical issues.

New Relic's Kubernetes integration includes monitoring Kubernetes events, nodes, pods, and container performance, providing a comprehensive view of your Kubernetes cluster's health and performance through a multidimensional representation of a Kubernetes cluster. This allows you to drill down into Kubernetes data and gain insights into your containers' and pods' performance and health.

Datadog

Datadog incorporates AI and machine learning for anomaly and outlier detection, making it easier to spot issues that deviate from standard patterns.

Datadog stands out because it can correlate logs and metrics, providing a unified view of what's happening in your Kubernetes environment. It also offers live container monitoring, which enhances dynamic container orchestration. In addition to the current events view, Datadog provides forecasting algorithms to alert users about possible problems with sufficient time to address them and avoid issues altogether
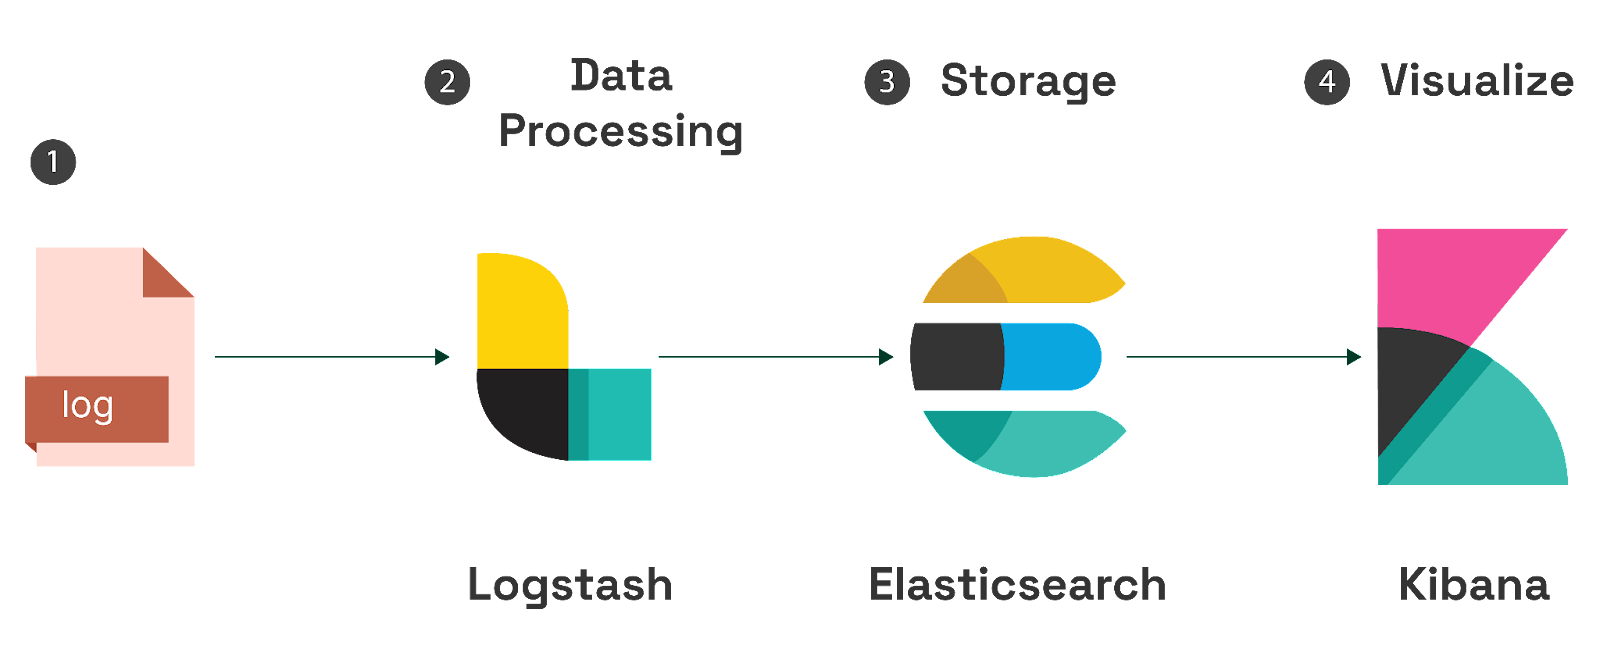
Elastic Stack

Elastic has recently introduced an AI Assistant, which is still in beta. The Elastic AI Assistant uses generative AI, powered by OpenAI, to provide contextual insights that explain errors and messages and suggest remediation. It also has chat conversations with the AI Assistant to request, analyze, and visualize your data.

AI-driven techniques and use cases

This section explores the transformative impact of AI in Kubernetes monitoring. We'll examine key AI-driven techniques and tie them to offering products or use cases. These techniques show the growing importance of AI in performance monitoring.

Anomaly pattern detection

AI algorithms excel at pattern recognition, which means they can detect anomalies that might elude traditional threshold-based monitoring systems. Unlike static thresholds, AI can adapt to changes in the environment, learning from historical data to identify what constitutes normal behavior and what does not.

For example, in a scenario where a Kubernetes cluster experiences an unusual spike in resource usage, AI can quickly discern whether this spike is a regular occurrence (like a predictable increase in traffic every Monday morning) or an anomaly that needs investigation.

This is one of the basic AI monitoring use cases. Most AI monitoring tools offer anomaly detection features, including the tools discussed in the previous section.

Predictive insights

AI doesn't just react to current states—it can also predict future issues. By analyzing trends and patterns, AI can forecast potential resource shortages or predict when your system might hit its limits.

With predictive insights, you can preemptively scale resources during expected high-load periods or optimize your deployments before issues become critical. For instance, if AI predicts a resource crunch due to an upcoming marketing campaign, you can scale up in advance to ensure smooth performance. The Datadog tool is known for predictive analysis; its documentation claims that its forecast alerts could notify teams a week before disk space is expected to run out based on recent trends and seasonal patterns in that system's disk usage.

Root cause analysis

Kubernetes environments can be complex, and pinpointing the exact cause of a problem is often challenging when something goes wrong. AI enhances root cause analysis by sifting through vast amounts of data to identify the source of a problem.

A tool like New Relic is excellent at conducting AI-powered root cause analysis for issues detected in Kubernetes environments. For example, as shown in this demonstration, the tool correlated several alerts to analyze a slow web portal response issue. The analysis revealed a recent database query optimization as the root cause, which was validated by deployment timelines and error rates. This showcases New Relic's efficiency in pinpointing issues and guiding swift resolution; check out its hands-on labs for more info.

Continuous improvement and learning

One of the most exciting aspects of AI in performance monitoring is its ability to learn and improve continuously. Over time, these AI systems become more adept at understanding the specific nuances of your Kubernetes environment.

As your Kubernetes setup changes and grows, the AI system adapts, ensuring that monitoring remains effective and relevant. For instance, an AI-based monitoring tool in a Kubernetes environment can learn over time that the streaming service scales out during peak hours and major event broadcasts and scales back in after the events.

As this technology continues to evolve, it will undoubtedly open new avenues for optimization and stability in Kubernetes operations.

Conclusion

Kubernetes has revolutionized the way organizations deploy and scale applications. However, with its power and flexibility comes the responsibility to ensure performance, stability, and resilience. Monitoring is not just a passive activity but also a proactive strategy that can be a game-changer when implemented effectively.

In this article, we delved into key considerations, including essential metrics like cluster-level resource usage and pod statuses, the role of advanced tools such as Prometheus and Grafana, and AI-enhanced tools like Dynatrace and New Relic.

We covered best practices, including granular monitoring and the importance of establishing performance baselines, and we addressed common challenges with practical solutions. The integration of AI in monitoring offers predictive insights and enhanced root-cause analysis, highlighting the future trajectory of Kubernetes monitoring.

In the end, a robust monitoring setup doesn't just protect applications; it empowers teams, drives innovation, and opens the door for a stable and efficient container orchestration operation experience.

Comprehensive Kubernetes cost monitoring & optimization

Continue reading this series