Learn how to monitor Kubernetes metrics for improved cluster management.

Kubernetes Metrics: Measure What Matters

In the ever-evolving field of cloud-native applications, Kubernetes stands out as the de facto orchestration platform standard. Businesses can scale, deploy, and manage containerized applications with unprecedented finesse by leveraging the potential of Kubernetes. However, a crucial necessity arises with its complexity and dynamism: monitoring.

In the context of Kubernetes, monitoring isn’t a mere requirement: It’s a foundational pillar ensuring applications’ stability, efficiency, and resilience. Given the transient nature of containers and the abstractions that Kubernetes introduces—like pods, services, and deployments—the state and performance of the system can change rapidly. Without adequate monitoring, identifying the root cause of issues becomes akin to finding a needle in a haystack, making timely troubleshooting almost impossible.

This article offers a detailed analysis of Kubernetes monitoring. We address essential Kubernetes metrics, explain methods for practical observation, and outline best practices for consistent monitoring. Spanning topics from the control plane to nodes and Kubernetes resources metrics, we aim to provide you with a thorough guide for ensuring stable Kubernetes operations

Summary of key Kubernetes metrics concepts

Concept Summary
Crucial Kubernetes metrics to monitor
  • Understand the primary metrics vital to Kubernetes monitoring and their underlying significance.
Hands-on: setting up the environment
  • Install prerequisites
  • Deploy an AWS EKS cluster
  • Become familiar with the Kube Prometheus stack.
Deep dive into Kubernetes metrics
  • Control plane metrics: Gain insights into metrics about the main Kubernetes components.
  • Node metrics: Learn about the metrics that monitor the worker machines in the cluster.
  • Resources metrics: Delve deep into various Kubernetes resource metrics and grasp their significance.
Best practices for Kubernetes metrics monitoring
  • Understand the guidelines on optimal monitoring frequency, efficient alert thresholds, and techniques to avoid alert fatigue.
  • Understand how to integrate and derive benefits from Kubecost for better cost management.

Crucial Kubernetes metrics to monitor

In Kubernetes, numerous components interact simultaneously, which makes it vital to obtain clear visibility into each component’s status and performance. Metrics, representing quantifiable data from the system, provide this visibility. By continuously collecting and analyzing these metrics, administrators can effectively manage a cluster and detect potential issues early.

To streamline our discussion and aid comprehension, we’ve grouped these metrics based on their operational scope within the Kubernetes ecosystem. This categorization—from overarching cluster metrics to specific pod metrics—ensures a structured and systematic overview.

Note that while we focus on a selection of core metrics in this article, Kubernetes offers a plethora of other metrics. The metrics highlighted below are foundational, but depending on specific operational needs, you may want to explore other specialized metrics.

Kubernetes cluster metrics

These highest-level metrics provide a bird’s-eye view, indicating whether the cluster functions optimally. For instance, monitoring cluster workload saturation can be instrumental. This metric reflects the degree to which the cluster can accommodate additional workload. It measures how close the cluster is to its maximum capacity in terms of CPU, memory, and storage usage across all nodes.

Control plane metrics

The control plane is central to Kubernetes, coordinating all cluster activities. Monitoring its components using metrics such as the following is essential to ensuring the system’s operational integrity:

  • etcd memory usage: Monitors the memory consumption of etcd, which is crucial for cluster state storage.
  • API server status: Tracks the API server’s health and availability, ensuring the functionality of the primary control plane component.
  • Scheduler latency: Measures the time it takes for the scheduler to make deployment decisions, which affects deployment speeds.

Node metrics

Each node is a worker machine in the Kubernetes cluster. Consistent monitoring here is crucial to preempt bottlenecks or failures, safeguarding the bedrock of the cluster’s operational landscape.

  • Node CPU utilization: Sustained high CPU utilization (e.g., over 90% for extended periods) can suggest that the node is overloaded. It’s essential to ensure that workloads are evenly distributed or consider adding more nodes or optimizing running applications.
  • Node memory utilization: If memory usage consistently reaches or exceeds the node’s limit, this indicates potential memory leaks or misconfigured applications. It could also mean that the node’s capacity needs expansion or workloads require optimization.
  • Disk pressure: This metric highlights when disk resources are nearing their limits. Persistent disk pressure can prevent new pods from being scheduled on the node, leading to application downtime or slowdowns. Monitoring for steady increases in disk usage or low remaining disk space can help preempt these issues. Regularly clean up unused data, optimize storage-intensive applications, or add more storage to address these concerns.

Pod metrics

Pods encapsulate the application containers. Their monitoring is crucial to ensuring the health of applications within the cluster, making these metrics vital for developers and operations teams:

  • Pod resource usage: Monitors the CPU and memory consumption of individual pods.
  • Pod status: Tracks whether pods are running, pending, or have failed.
  • Pod restart rate: Indicates the frequency of pod restarts, which can signal instability in applications.

Hands-on: setting up the environment

For this demonstration, we’ll use Amazon Elastic Kubernetes Service (AWS EKS) as our platform of choice. You can also use other managed Kubernetes services, like Azure Kubernetes Service (AKS) or Google Kubernetes Engine (GKE). For those with experience with local deployment tools, options such as minikube and K3s are valid alternatives.

Prerequisites

To proceed with this guide, ensure that the following tools are set up on your local machine:

Remember that operating a managed Kubernetes cluster with a cloud provider comes with associated hourly charges. For this demonstration, we minimize expenses by leveraging AWS spot instances. Remember to terminate the resources post-demo to avoid ongoing costs.

Deploying an AWS EKS cluster

For this demo, we’ll be using Amazon Elastic Kubernetes Service (AWS EKS). However, this guide is also applicable to other managed Kubernetes services like Azure Kubernetes Service (AKS) or Google Kubernetes Engine (GKE). If you’re working in a local environment, tools such as minikube and K3s are suitable alternatives that can be used effectively.

Our deployment utilizes eksctl to create an AWS EKS cluster. Begin by creating a cluster.yaml file with the following configuration:

apiVersion: eksctl.io/v1alpha5
kind: ClusterConfig
metadata:
  name: k8s-metrics-demo
  region: us-east-1
iam:
  withOIDC: true
managedNodeGroups:
  - name: node-group-spot
    instanceTypes: ["t3.small", "t3.medium"]
    spot: true
    desiredCapacity: 2
    volumeSize: 8
addons:
  - name: vpc-cni
  - name: coredns
  - name: aws-ebs-csi-driver
  - name: kube-proxy

This configuration deploys an AWS EKS cluster k8s-metrics-demo in the us-east-1 region. It includes a managed node group named node-group-spot with spot instances for cost efficiency, using a combination of t3.small and t3.medium instances. The group is configured for two nodes with an 8 GB volume size. The add-ons specified are essential for the cluster’s functionality, covering aspects like the VPC CNI plugin, CoreDNS, AWS EBS CSI driver, and kube-proxy.

To deploy the cluster, run:

> eksctl create cluster -f cluster.yaml

Following successful creation, the output will confirm the readiness of the EKS cluster:

EKS cluster "k8s-metrics-demo" in "us-east-1" region is ready.

Comprehensive Kubernetes cost monitoring & optimization

Next, update the kubeconfig file to access the newly created cluster:

> aws eks --region us-east-1 update-kubeconfig --name k8s-metrics-demo

Finally, verify access to the cluster by retrieving the Pods from all namespaces:

> kubectl get pods -A

Kube Prometheus stack

To demonstrate metrics effectively, we’ll deploy the kube-prometheus-stack, an open-source solution tailored for Kubernetes cluster monitoring that integrates Prometheus, Alertmanager, and Grafana components. The kube-prometheus-stack features integrated dashboards that display a wide range of metrics, allowing us to assess the state of Kubernetes and its applications.

Begin by adding and updating the helm repository for the kube-prometheus-stack:

> helm repo add prometheus-community https://prometheus-community.github.io/helm-charts
> helm repo update

With the repository set up, install the kube-prometheus-stack chart on the cluster previously established:

> helm install kube-prometheus-stack prometheus-community/kube-prometheus-stack

Upon successful installation, you’ll receive the following output:

NAME: kube-prometheus-stack
LAST DEPLOYED: Fri Sep 29 13:00:06 2023
NAMESPACE: default
STATUS: deployed
REVISION: 1
NOTES:
kube-prometheus-stack is now active. Verify its status with:
kubectl --namespace default get pods -l "release=kube-prometheus-stack"

To utilize the integrated Grafana dashboards, follow these steps. First, retrieve the Grafana login password:

> kubectl get secret kube-prometheus-stack-grafana -o jsonpath="{.data.admin-password}" | base64 --decode ; echo

Establish a connection to the dashboards:

> kubectl port-forward svc/kube-prometheus-stack-grafana 3000:80

Finally, navigate to http://localhost:3000 to access Grafana. Use the default username admin and the password obtained from the earlier command.

Deep dive into Kubernetes metrics

Kubernetes continuously generates vast amounts of data as it operates, representing the state and performance of its various components. Through Grafana dashboards, this data is organized into actionable insights, offering a clear perspective on the state of the cluster. These dashboards provide a granular view into the inner workings of the cluster, from a broad overview of its health to the specifics of individual pods.

Administrators and engineers can achieve a nuanced understanding, make informed decisions, facilitate quicker troubleshooting, and ensure optimized performance by referring to and interpreting these dashboards. This section delves into the most pertinent metrics, directly referencing specific Grafana dashboards and highlighting their relevance within the Kubernetes ecosystem.

Kubernetes cluster metrics

At the top level, it’s essential to observe the health, accessibility, and performance of the Kubernetes cluster; these metrics highlight the cluster’s operational status. For instance, resource saturation measures the utilization of primary cluster resources such as CPU, memory, and storage. Keeping an eye on this metric ensures that resources are manageable to avoid disrupting cluster performance.

Kube-prometheus-stack provides out-of-box dashboards for cluster high-level monitoring. In Grafana, search for Kubernetes / Compute Resources / Cluster and Kubernetes / Networking / Cluster dashboards.

  • Kubernetes / Networking / Cluster: This dashboard concentrates on the cluster’s networking aspects. It showcases data traffic, request handling, and network efficiency metrics, enabling you to monitor data flow within your Kubernetes cluster.
K8s clusters handling 10B daily API calls use Kubecost
  • Kubernetes / Compute Resources / Cluster: Focusing on the computational side, this dashboard visualizes the cluster’s resource consumption. It highlights CPU, memory, and storage utilization, ensuring that the cluster operates within optimal resource limits.

Control plane metrics

The control plane acts as Kubernetes’ orchestrator, directing all cluster actions. Ensuring the health of its components is paramount for cluster reliability and performance.

Metric Name Description Importance
etcd_memory_usage_bytes etcd, as the primary configuration storage for Kubernetes, holds vital data. Excessive memory usage can hinder etcd’s performance or cause failures. Ensure that etcd operates within acceptable memory limits.
apiserver_up The API server facilitates primary interactions within the Kubernetes cluster. Downtime or instability in the API server can paralyze cluster operations. Ensure timely intervention when disruptions occur.
scheduler_e2e_scheduling_duration_seconds The scheduler’s role is to allocate pods to nodes. High latency could lead to pod deployment delays, potentially causing service disruptions or resource inefficiencies.
apiserver_request_total Captures the total number of requests hitting the API server. A request surge could indicate abnormal behavior, potentially stressing or overwhelming the API server.
workqueue_depth Monitors the depth of the queue in the controller manager, reflecting pending processing items. An increased queue depth might indicate that controllers are struggling with tasks, potentially causing operational delays.
etcd_disk_backend_commit_duration_seconds Measures the disk I/O durations for etcd writes and reads. Slower I/O operations can affect the responsiveness of etcd, potentially delaying or interrupting configuration changes and data retrieval.
etcd_server_leader_changes_seen_total Tracks the number of times leadership changes in the etcd cluster. Frequent leader changes can indicate network issues or an unstable etcd cluster, potentially compromising data integrity and availability.

There are several noteworthy kube-prometheus-stack dashboards for control plane monitoring.

Kubernetes / API server:

CoreDNS:

Kubernetes / Proxy:

Node metrics

Nodes, specifically worker nodes, play a vital role in a Kubernetes cluster, executing the tasks and running the containers. Monitoring each node ensures the stable foundation of the cluster’s operations.

Metric Name Description Importance
Node network traffic (ingress/egress) This metric measures the amount of data entering and leaving a node. It includes traffic to and from pods running on the node. Monitoring network traffic helps identify potential bottlenecks or unusual network activity, which could indicate network saturation or security issues.
Node filesystem utilization Tracks the filesystem usage on a node, which is particularly important for nodes hosting stateful applications or databases. High filesystem utilization can lead to a lack of space for new data, impacting application performance and stability. It can also be an early indicator of data management issues within applications.
Node pod capacity Compares the number of pods running on a node compared to the node’s total pod capacity. This metric is crucial for understanding the workload distribution across the cluster. It can highlight whether specific nodes are underutilized or overburdened, guiding load balancing and scaling decisions.

Kube-prometheus-stack dashboards for node monitoring include the following.

Learn how to manage K8s costs via the Kubecost APIs

Kubernetes / Compute Resources / Node (Pods):

Node Exporter / Nodes:

Pod metrics

Pods are the fundamental units encapsulating application containers in Kubernetes. Monitoring them ensures the well-being of applications inside the cluster.

Metric Name Description Importance
Pod resource usage Monitors the CPU and memory consumption of individual pods. High resource usage can hint at inefficiencies or issues in the application, potentially affecting performance or leading to evictions.
Pod status Tracks the operational state of pods (running, pending, or failed). Monitoring status helps quickly identify problematic pods, aiding in swift troubleshooting and maintaining application availability.
Pod restart rate Indicates the frequency of pod restarts. A high restart rate can signal application instability or issues, demanding attention to maintain seamless operations within the cluster.

Kubernetes / Compute Resources / Pod is a kube-prometheus-stack dashboard for pods monitoring.

Clean-up

To delete the EKS cluster and other AWS resources, execute the command below in the directory where you created the cluster.yaml file.

❯ eksctl delete cluster -f cluster.yaml --disable-nodegroup-eviction --force

Best practices for Kubernetes metrics monitoring

Understand system behavior and the importance of granularity

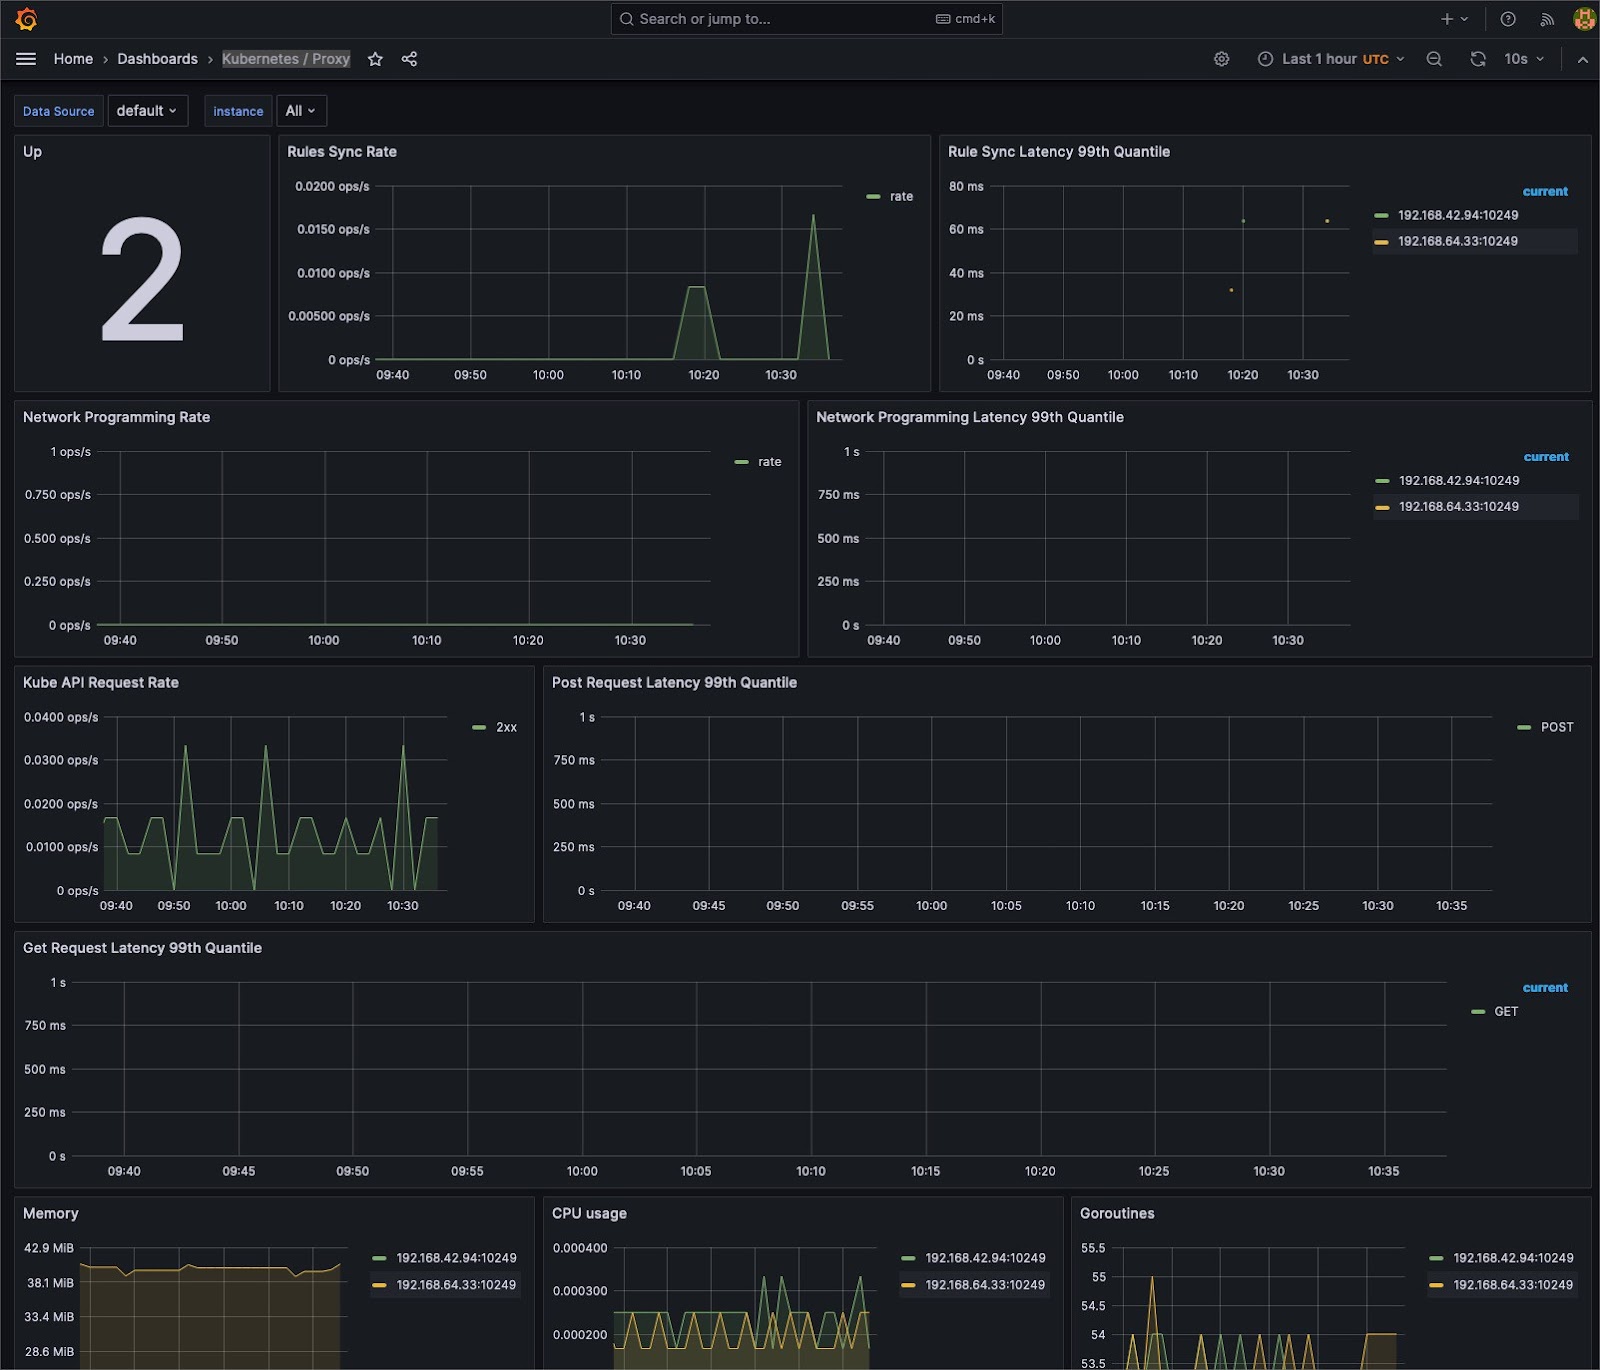
Understanding system behavior often requires different levels of detail. Aggregate metrics offer a holistic system overview, but granular data can pinpoint specific issues.

Cluster administrators can seamlessly switch between cumulative views and instantaneous snapshots by utilizing tools such as Prometheus, which supports counter and gauge metrics. This dual capability facilitates precise debugging and broad system health checks, ensuring that both micro and macro perspectives are attainable.

Use case: If your system’s response time suddenly increases, an aggregate metric might show the overall spike. However, granular data can pinpoint that a specific microservice, perhaps the user authentication service, is the root cause.

Set up meaningful alerts

Efficient alerting is all about catching anomalies without getting drowned in noise. Alertmanager stands out by integrating with Prometheus and providing functionalities like group-based alert routing, deduplication, and silencing. This sophistication ensures that alerts are generated and reach the appropriate teams in a format conducive to action, improving the signal-to-noise ratio.

Use case: Consider a scenario where a specific pod experiences frequent restarts. Instead of getting an alert for every restart, Alertmanager can consolidate these into a single alert with the number of restarts within a time frame.

Establish a baseline

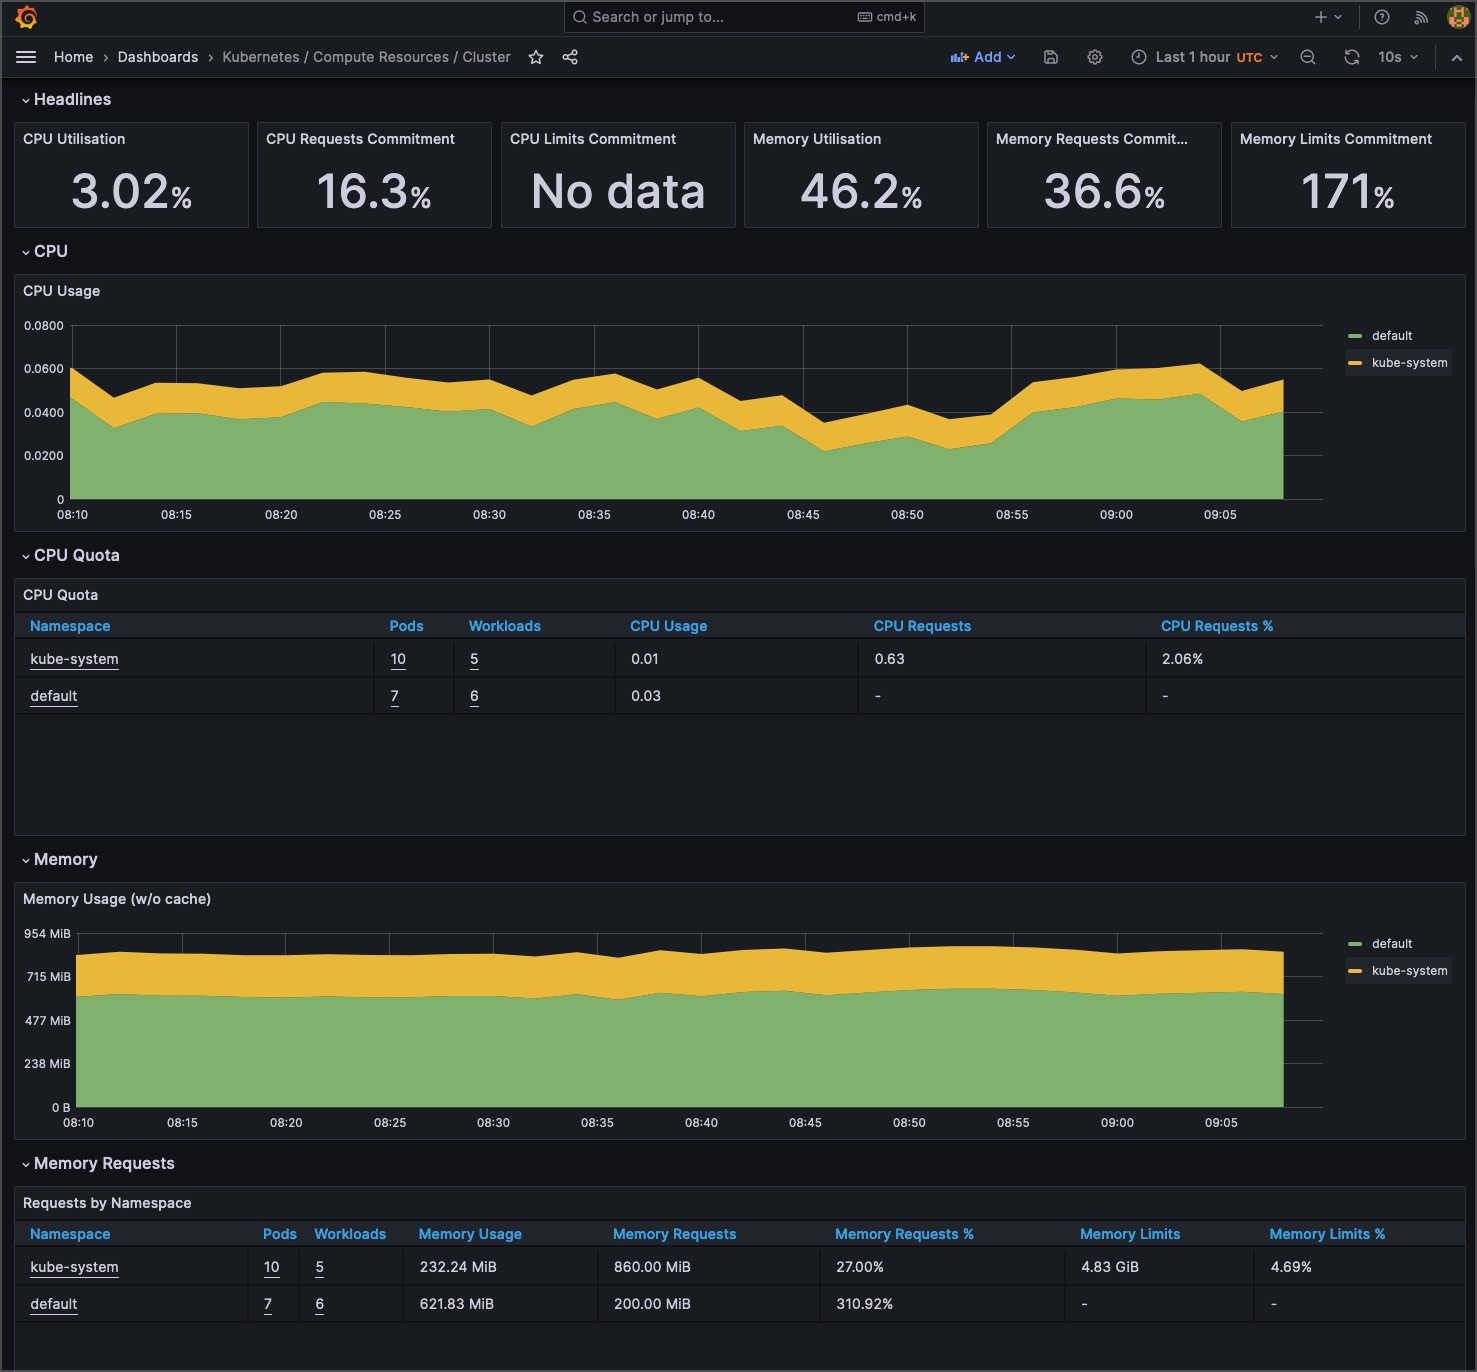
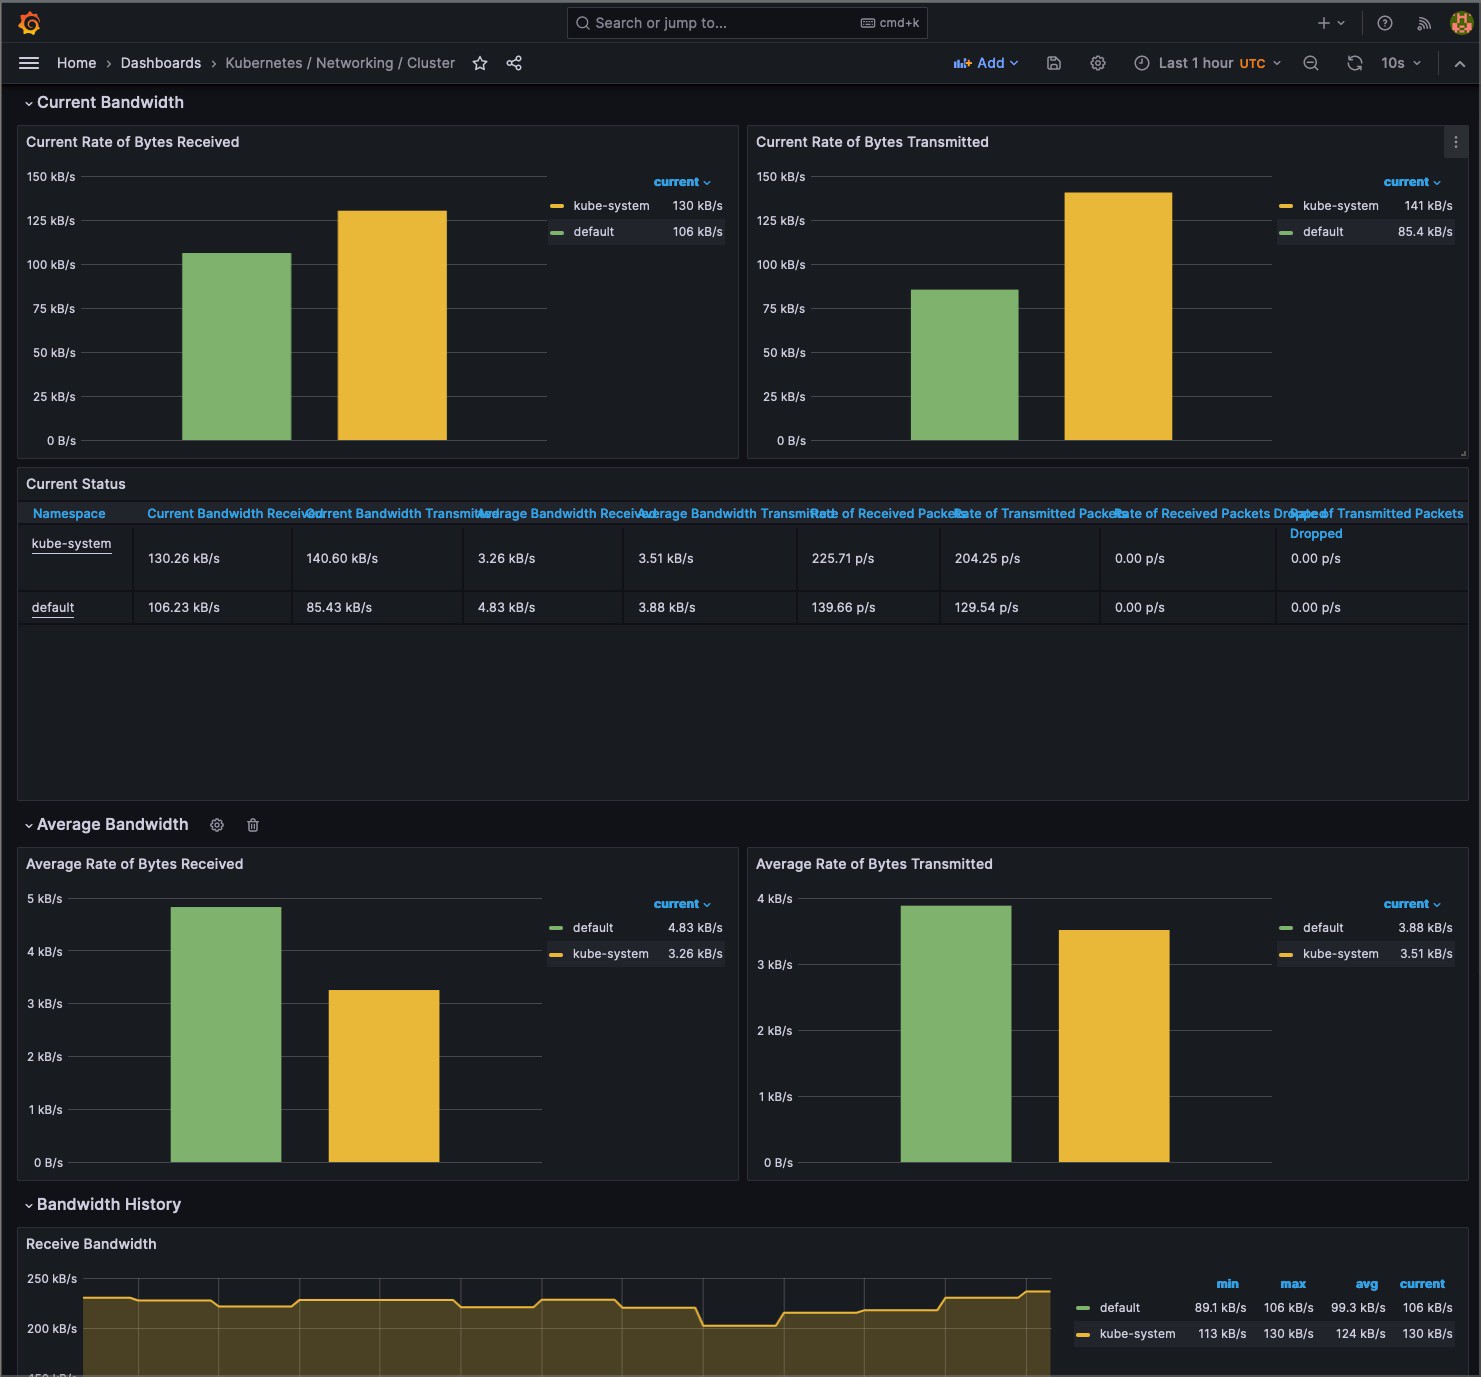
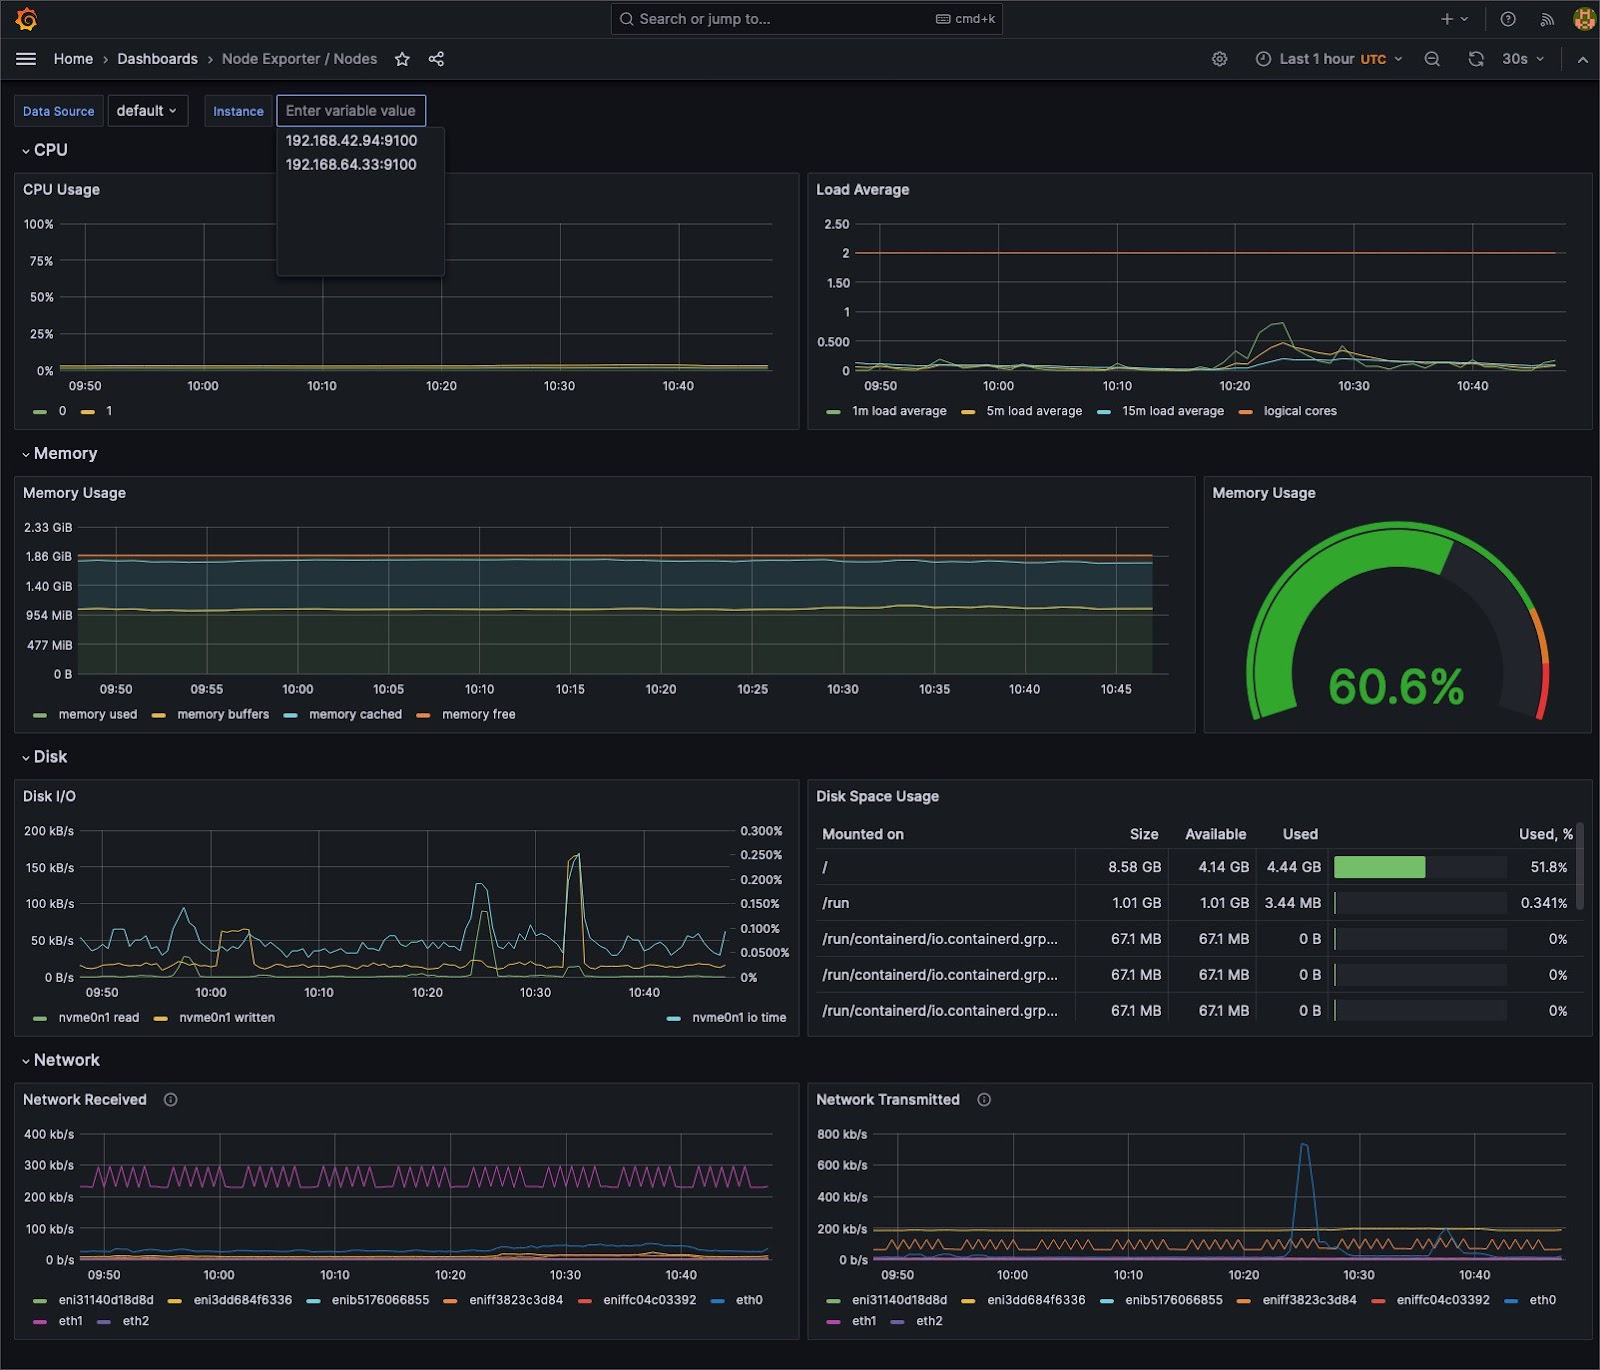
For any monitoring system to detect anomalies, it must first understand the “norm.” Tools like Grafana provide the means to visualize data over time, allowing teams to identify typical cluster behavior patterns. This temporal understanding and a comprehensive time-series database provide the essential context for recognizing deviations, ensuring proactive responses rather than reactive firefighting.

Use case: Over the course of a month, you might observe that memory usage peaks every Friday. This pattern becomes your baseline, so if memory spikes unusually on a Wednesday, you know it’s an anomaly worth investigating.

Leverage auto-scaling based on metrics

The built-in auto-scaling capabilities of Kubernetes, such as the Horizontal Pod Autoscaler (HPA) and Cluster Autoscaler, are potent mechanisms. When parameterized with precise metrics from Prometheus, they allow Kubernetes clusters to adapt in real time based on accurate metrics to ensure optimal resource utilization, balancing performance with cost.

Use case: Suppose an e-commerce application experiences a surge in traffic during a sale. With metrics-driven auto-scaling, Kubernetes can automatically spawn additional pods to handle the load, ensuring that the app remains responsive.

Monitor cluster dependencies

Kubernetes interacts with many external systems, each a potential point of bottleneck or failure. Tools like Prometheus can be expanded with exporters to pull metrics from various sources, like databases, caches, or other services. By casting this wide monitoring net, you ensure that no internal or external component escapes scrutiny.

Use case: If an application relies on a Redis cache, monitoring the cache’s hit rate and response times can provide insights. A sudden drop in the hit rate might suggest an issue with the application logic.

Regularly review and update the monitoring setup

A static monitoring configuration can become a liability over time. As applications and infrastructure evolve, so should the monitoring setup. The Prometheus Operator simplifies management and updates, especially with custom resources like service monitors.

Regular reviews ensure that monitoring remains aligned with the dynamic nature of Kubernetes deployments.

Use case: A new service added to your application should be accompanied by relevant monitoring checks. If you deployed a new payment gateway, you would want metrics and alerts for its response times and failures.

As the ecosystem evolves, so should the monitoring setup. Regular revisions ensure that the monitoring remains in tune with the current state of Kubernetes deployments.

Set up proactive controls with probes in Kubernetes

Kubernetes offers proactive controls that enable administrators to maintain the health and performance of applications and nodes. Liveness, readiness, and startup probes are vital tools in this regard:

  • Liveness probes: These probes ensure that applications within containers are running correctly. If an application fails the liveness probe, Kubernetes restarts the container, providing self-healing capabilities to resolve issues such as deadlocks or unresponsive processes.
  • Readiness probes: These probes determine if a pod is ready to accept traffic. This ensures that services don’t route traffic to pods that aren’t ready, which is crucial during startup or after a deployment.
  • Startup probes: As suggested by the name, startup probes are used to manage the startup phase of a container. For applications with a slow startup time, a startup probe ensures that Kubernetes doesn’t kill the application before it’s fully started. It provides a way to delay the execution of liveness and readiness probes, giving long-starting applications enough time to initialize.

Integrate cost monitoring with Kubecost

Cluster efficiency is a balancing act between performance and cost. Kubecost was explicitly built for Kubernetes and bridges the gap between operational metrics and financial insights. It delves deeply into Kubernetes metrics, extrapolating granular cost data. This approach ensures that you track performance and understand the financial implications of your cluster’s behavior.

By segmenting costs based on parameters such as namespace, workload, or labels, Kubecost makes opaque cost structures transparent. Its integration with Grafana enhances visualization, enabling teams to spot trends, predict future costs, and make informed budgeting decisions. In addition, its alerts and efficiency recommendations provide actionable insights, assisting teams in optimizing both performance and costs.

With Kubecost, the financial dimension of Kubernetes operations becomes a tangible, manageable entity, promoting proactive cost management.

Conclusion

In this guide, we thoroughly explored Kubernetes metrics monitoring. We identified the crucial metrics essential for Kubernetes and explained their significance.

Practical implementation was demonstrated using AWS EKS and the Kube Prometheus stack, offering readers tangible skills in setting up and managing a Kubernetes environment.

Our in-depth analysis of Kubernetes metrics provided a detailed perspective on the control plane, nodes, and Kubernetes resources, ensuring comprehensive coverage of monitoring touchpoints. The best practices section emphasized the importance of proactive monitoring, meaningful alerting, and the integration of cost management tools, particularly highlighting Kubecost’s capabilities.

Continuously updating and refining your approach to Kubernetes metrics monitoring is essential. Use your hands-on experiences as a guide, adjust your methods based on outcomes, and consistently improve your monitoring skills. This ongoing effort will ensure that you effectively manage and scale Kubernetes environments regardless of their complexity levels.

Comprehensive Kubernetes cost monitoring & optimization

Continue reading this series