Learn about the valuable features and minimalistic architecture of the open-source logging solution, Grafana Loki, and how to integrate it with Kubernetes for optimal performance and scalability in a microservices environment.

Learn Grafana Loki

Grafana Loki is a relatively new open-source logging solution that handles the scale of modern cloud-native environments, such as microservices running on Kubernetes. The project provides valuable features for Kubernetes administrators, like native integration with the existing Prometheus/Grafana software stack and allowing administrators to view metrics and logs via a unified interface.

This article explains Grafana Loki's architecture, how it works, its use cases, how to install it, and best practices for logging. By the end of the article, you will be familiar with the Grafana Loki logging solution and should feel confident enough to experiment with this project yourself.

Summary of key Grafana Loki concepts

Scalable logging Grafana Loki is a modern open-source logging tool that handles the large log volumes generated in a complex Kubernetes microservices environment.
Index-free scalability Loki's key features are index-free logging and horizontal scalability, which provide high performance even with a significant log ingestion volume.
Minimalistic architecture The Loki project only requires a few components: a distributor that receives log writes, an ingester that pushes logs to backend storage, and a queue that responds to user queries via LogQL.
Kubernetes integration Loki can be installed via a single Helm chart, a Kubernetes-native approach to software installation. The Grafana visualization tool is integrated by simply adding Loki as a data source.
Best practices for performance analysis and optimization Operating Loki requires analyzing performance metrics to determine scalability bottlenecks, applying metadata labels correctly to optimize query performance, and following security best practices to protect log data from insecure access.

What is Grafana Loki?

Loki was developed by Grafana Labs and announced in 2018. The open-source project has over 21,000 stars on GitHub and is actively used in production systems by many organizations.

Grafana is a commonly used tool by Kubernetes administrators looking to visualize Prometheus metrics via visual dashboards. Loki integrates with the same Grafana dashboard interface, allowing administrators to view logs and metrics in the same place and maintain a consistent user experience. Loki can be easily deployed to Kubernetes via a simple Helm chart and integrates with the Grafana dashboard tool with a few clicks (which we'll go through below).

Another goal of the Loki project is to handle large-scale log volumes, which it accomplishes by bypassing the full indexing approach implemented by traditional logging tools like Elasticsearch. Typically, every field of a log message is indexed for searchability, which impacts cost, performance, and search query performance. Loki uses a different approach called “index-free logging” where an index is created only based on the label metadata assigned to a log stream. Administrators can curate the label metadata to optimize log query performance.

The concept of labels will already be familiar to Prometheus users in the context of metrics labels that enable easier searchability. By relying exclusively on label metadata for indexing, Loki can achieve much higher performance for log ingestion and query responses than traditional logging tools, making this solution favorable for large microservice environments generating massive log volume.

The native integration with an existing Prometheus/Grafana stack and the scalability benefits for microservice environments make Loki suitable for many use cases. However, as with any new tool, administrators should carefully investigate and experiment with the solution and consider their use cases to determine whether the project fits their needs.

Features and use cases

Loki has unique features that support modern, cloud-native environments like Kubernetes. While the features are valuable for many use cases, administrators will benefit from carefully evaluating whether the feature set is appropriate for their organizations and the cluster architectures they are using.

Index-free logging

Unlike traditional logging solutions that index all the content of every log message - like the ELK stack - Loki only indexes the label metadata. This approach significantly reduces storage requirements and the computational overhead of log ingestion and querying. This simpler indexing approach enables organizations to leverage Loki for environments with larger log volumes while being cost-effective with compute and storage resources. Faster query latencies improve the user experience.

The disadvantage of Loki's indexing approach is that log queries have flexibility limitations. Since the entire log message is not indexed, optimal queries must reference only the labels associated with a log message. Querying based on the actual contents of the log message would require a full scan search - also called “brute-force” search - which is computationally expensive.

Administrators will need to evaluate whether the types of logs generated in their environments suit the index-free approach or whether the traditional approach of fully indexing the log messages is more appropriate. Generally, environments that generate primarily unstructured logs are better suited to a fully indexed approach. An index-free approach may be more suitable if the log messages are structured (e.g., in JSON format).

Integration with Grafana, Prometheus, and Kubernetes

A significant benefit of Loki is its native integration with Grafana, Prometheus, and Kubernetes. Administrators configuring their Kubernetes clusters with Grafana and Prometheus for metrics collection and visualization will find it easy to enable Loki for log aggregation. Loki integrates with Grafana dashboards to visualize metrics and logs from the same place.

Accessing metrics and logs in the same visualization tool is an essential benefit from a user-experience perspective. If the user is familiar with querying Prometheus metrics via Grafana, the barrier to upskilling Loki users is reduced. Troubleshooting and investigating workloads can be done faster when metrics and logs are easily accessible from the same tool.

The familiar Grafana visualization tool with Loki integration enabled

The familiar Grafana visualization tool with Loki integration enabled

The first-class Kubernetes support provided by Loki means that the project natively understands how to organize Kubernetes logs with critical labels like namespace, node, and pod names out of the box. There are also vendor-supported Helm charts to enable easy installation and software upgrades.

Administrators using metrics collection and visualization tools other than Prometheus and Grafana may want to consider whether their selected metrics software stacks provide any integration with other logging tools. In that case, other logging tools may be more suitable than Loki.

Multi-tenancy and access control

Grafana Loki supports multi-tenancy and access control out of the box, allowing different teams and customers to share the same Kubernetes infrastructure while still isolating their log data. Every log message can be tagged with a “tenant ID” to identify the tenant the data belongs to, restricting each tenant's queries to view only their log messages. The Grafana visualization tool also supports its role-based access control (RBAC) setup, allowing administrators to configure roles with granular permissions for access to metrics, log data, and dashboards.

Simple querying and filtering with LogQL

Loki provides a reasonably straightforward syntax for performing log queries called LogQL which is an advantage over many logging tools with more complex syntaxes. This is a byproduct of the index-free logging strategy, which enables a simple query syntax based on label metadata and key/value pairs.

Here is a minimal example of a LogQL query that will display logs from all pods containing a particular label key/value:

{app="nginx"}


We can extend the example to filter based on an environment, container, and log messages containing the word “error”:

{app="nginx", environment="production", container="frontend"} |= "error"


Many log expressions are supported, like regular expressions and JSON parsers, to allow for fine-grained queries.

Comprehensive Kubernetes cost monitoring & optimization

Architecture of Grafana Loki

Loki has key components that enable log ingestion, storage, and querying functionality. Understanding how these components work will help you troubleshoot and optimize performance when deploying Loki to a production environment.

The key takeaway about Loki's architecture is that only a few simple components are involved, all of which are horizontally scalable. The index-free approach and integration with third-party storage backends mean that Loki's setup is simple, making it easier for administrators to understand its design and quickly troubleshoot and resolve scaling bottlenecks. These components' storage and computational requirements are minimal, allowing the project to scale to larger log volumes than traditional logging solutions typically allow.

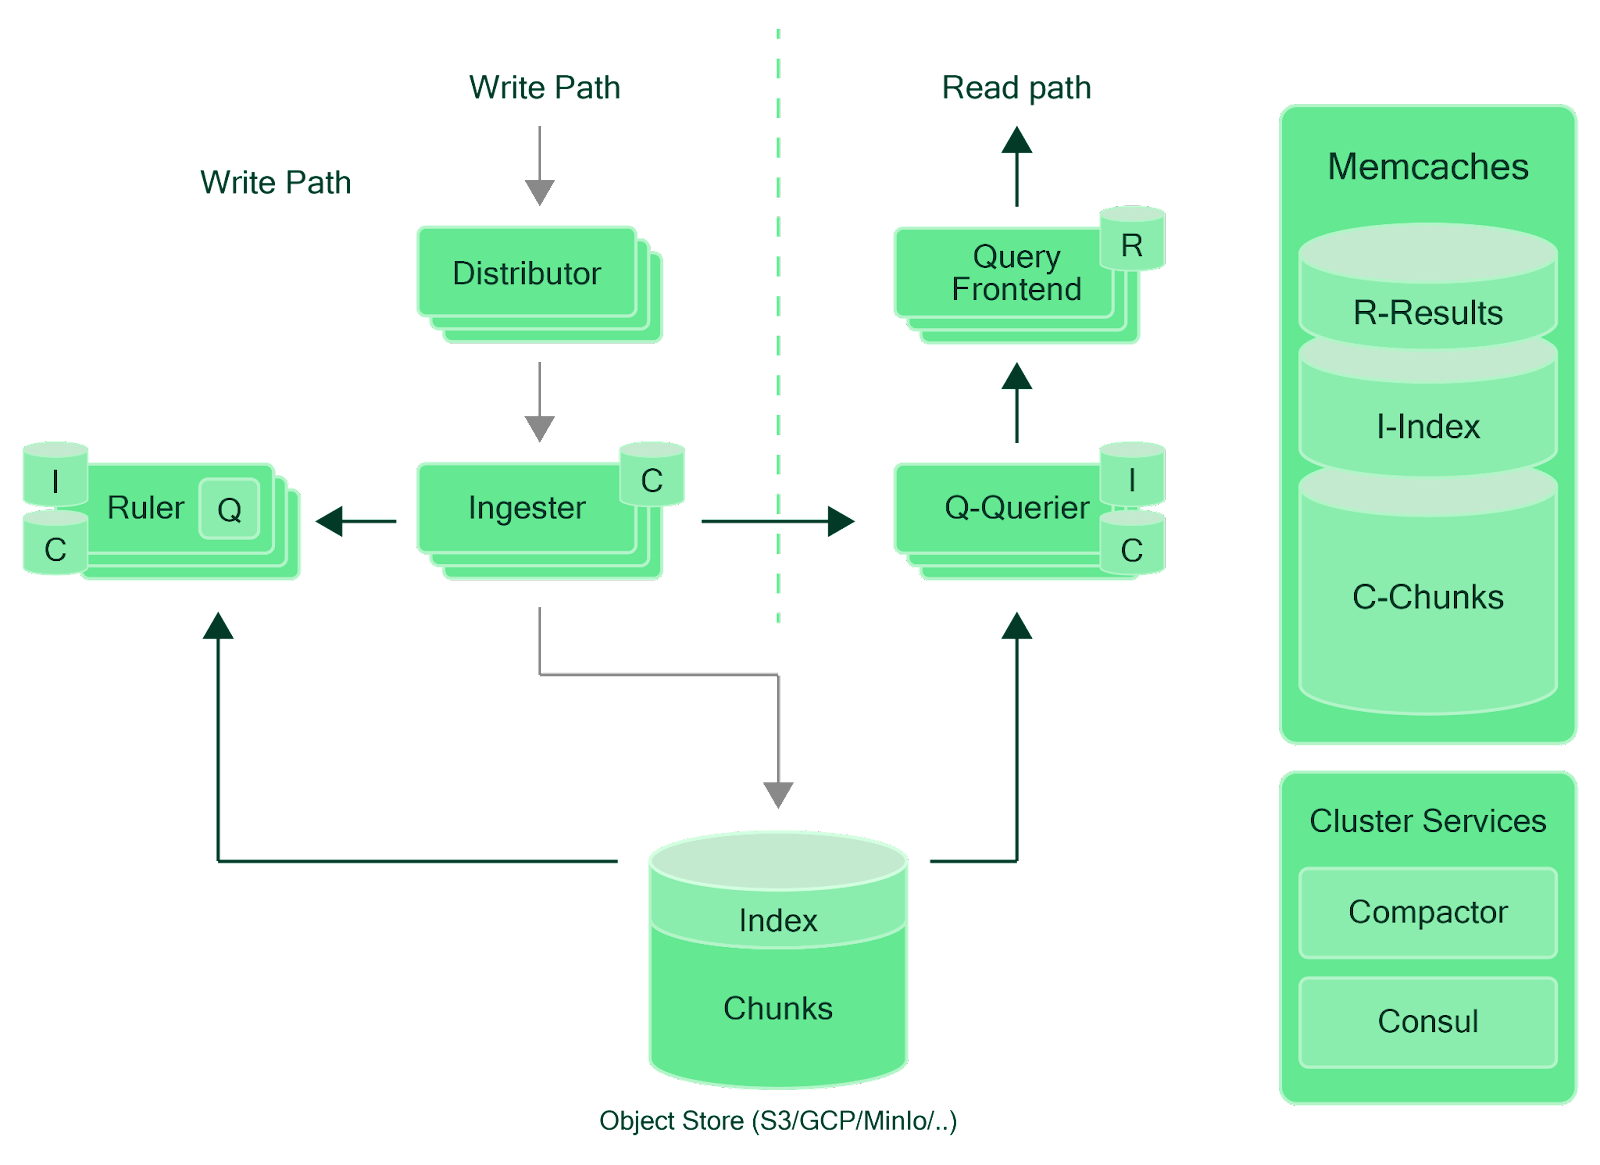
The above image illustrates the various components of Grafana Loki and the path of reads/writes executed. (Source: grafana.com)

The above image illustrates the various components of Grafana Loki and the path of reads/writes executed. (Source: grafana.com)

Promtail

This is an agent that runs as a Kubernetes DaemonSet. It is responsible for collecting logs from the worker node and pushing them to Grafana Loki's other components for writing to log storage. Promtail will collect node system logs (like the SystemD journal), pod logs, and other relevant log files typically located at /var/log/*.

Distributor

This service handles incoming write requests from Promtail or other log writers. The Distributor is responsible for validating incoming log streams (such as timestamp data and log length), applying rate limiting, splitting incoming streams into separate “chunks,” and forwarding the stream to the Ingester component. The Distributor component is stateless and horizontally scalable by enabling additional replicas fronted by a load balancer. This is valuable for increasing Loki's throughput of log volume.

Ingester

This component writes the log stream data to backend storage, such as AWS S3. The Ingester will receive log data as chunks from the Distributor and keep them in memory until a periodic flush occurs, pushing the data to persistent storage. Like the Distributor component, the Ingester can scale horizontally with multiple replicas - the Distributors will be responsible for load-balancing log chunks across Ingester replicas.

Querier

As the name suggests, this component handles incoming LogQL queries, reading data from the Ingester or directly from the backend storage. The Querier is highly efficient because it automatically treats the Ingester replicas as in-memory caches. It first checks those components for log data before resorting to a slower read operation on the backend storage. This strategy limits the need for administrators to manually implement read caching for their log queries. Querier components are horizontally scalable, so administrators can configure multiple replicas to balance the query load.

Ruler

Loki can be configured with alerting rules to trigger notifications based on LogQL queries. For example, log events related to security issues may require alerting the administrator. If the cluster administrator has already set up the Prometheus component called Alert Manager, integration with Loki's Ruler component will be as straightforward as enabling Prometheus metrics alerting rules.

Getting started with Loki on Kubernetes

Administrators should experiment with the Loki tool to better understand how it's set up and how it integrates with Grafana. The tutorial below will walk you through a simple Loki setup on a standard Kubernetes cluster.

Prerequisites

  • You'll need to have an existing Kubernetes cluster up and running. A project like K3s can help you run a cluster locally for this tutorial, but any existing cluster on your local machine or a cloud provider will also work perfectly.
  • The kubectl command-line tool must be installed and configured to communicate with your cluster.
  • The Helm package manager is required to install Helm charts to your cluster. Loki supports an alternative installation approach without Helm if you prefer.

Setup steps

1. Add Loki's Helm chart repository

The Helm package manager needs to know where to find Grafana-related Helm charts to install into your cluster. The repository below contains the charts for deploying Loki and other Grafana projects.

helm repo add grafana https://grafana.github.io/helm-charts
helm repo update
K8s clusters handling 10B daily API calls use Kubecost


2. Install Grafana

You may already have this installed in your cluster for visualizing Prometheus metrics. If not, use the Helm command below to set up Grafana. We'll use Grafana to visualize the logs collected by Loki.

helm upgrade --install grafana grafana/grafana


3. Connect to Grafana

The output of the installation command above will provide details on how to connect to the Grafana tool via your web browser. The output will also show you a password to use for the initial login. For a production environment, this password will need to be changed.

The command for connecting to Grafana may look like this (verify that your port number matches the instructions provided by Helm):

kubectl port-forward svc/grafana 8080:80


This will allow you to navigate to localhost:8080 on your web browser, and the request will be automatically forwarded to your Grafana pods. Log in with the “admin” username and the password provided to you when you ran the Helm installation command.

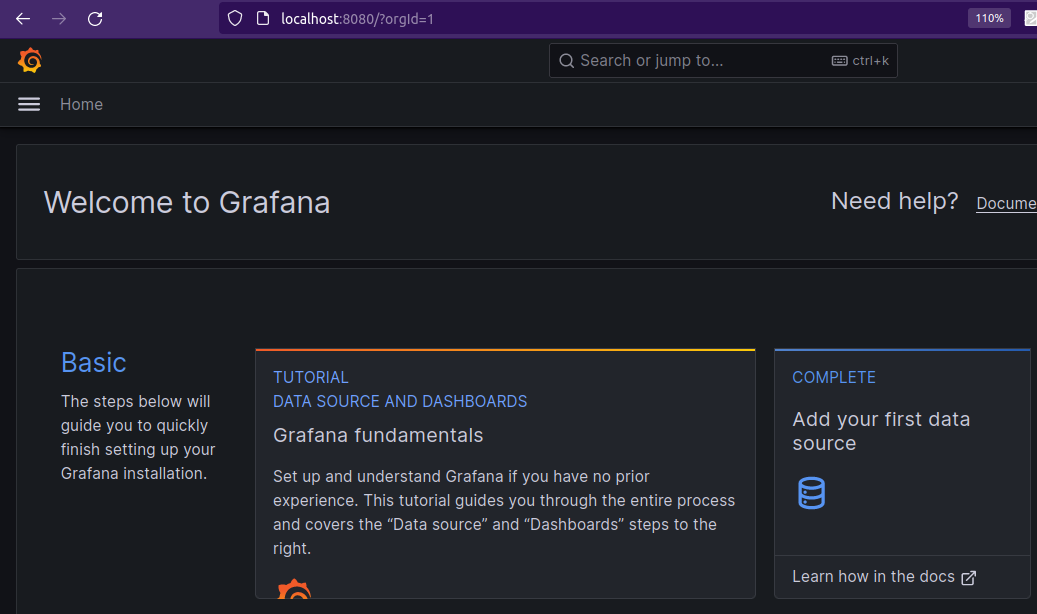
This page should be visible on localhost:8080 when a port forward has been executed.

This page should be visible on localhost:8080 when a port forward has been executed.

4. Install Loki

Once you've confirmed that the Grafana interface is working, you can install Loki.

First, set up a simple configuration file for Loki with some basic default settings. Create the following values.yaml file via your text editor:

# values.yaml
loki:
  commonConfig:
    replication_factor: 1
  storage:
    type: 'filesystem'
  auth_enabled: false
singleBinary:
  replicas: 1


This configuration is suitable for quickly testing the Loki project. It sets the number of replicas to 1, sets the storage backend to the local filesystem, and turns off authentication requirements. These settings must be updated for production environments, but we'll focus on getting a basic setup up and running for now.

With the file above created, we're ready to deploy Loki:

helm upgrade --install --values values.yaml loki grafana/loki
kubectl get pods # Verify the Loki Pods are running successfully.


5. Connect Grafana to Loki

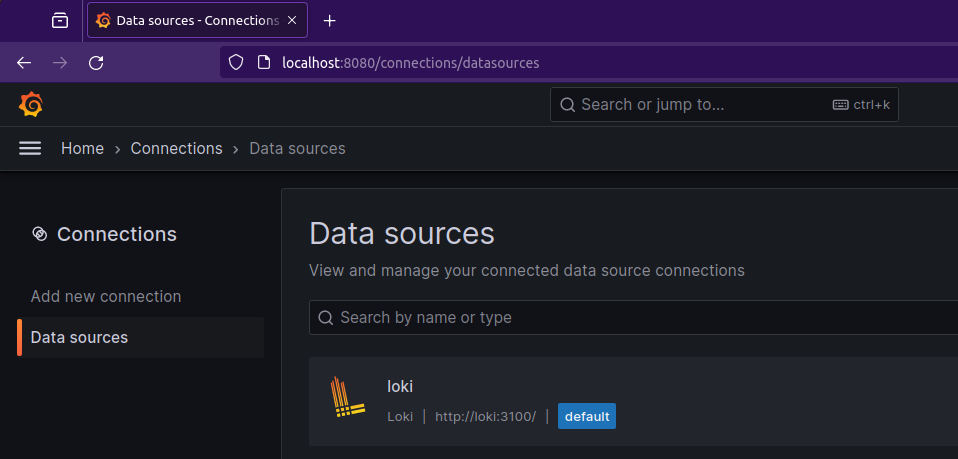
Loki will now begin to collect logs from your Kubernetes cluster, and we want to query and visualize those logs via Grafana. Go back to the browser page where you opened Grafana. On the left side, select Connections > Data Sources > Add data source, and search for Loki. Once selected, the server URL is the only parameter you need to modify on the Loki configuration page. The value here tells Grafana how to connect to the Loki solution. Input the following value to guide Grafana to connect to the Kubernetes service called “loki,” which is listening at port 3100 by default:

http://loki:3100/
# We can verify this Kubernetes Service exists by running `kubectl get services`.

Save your changes, and then select Explore in the left menu panel. Loki will be available in the Data Source dropdown.

6. Run your first LogQL query

You'll now see the LogQL interface for performing queries with Loki. You can run a sample query like this:

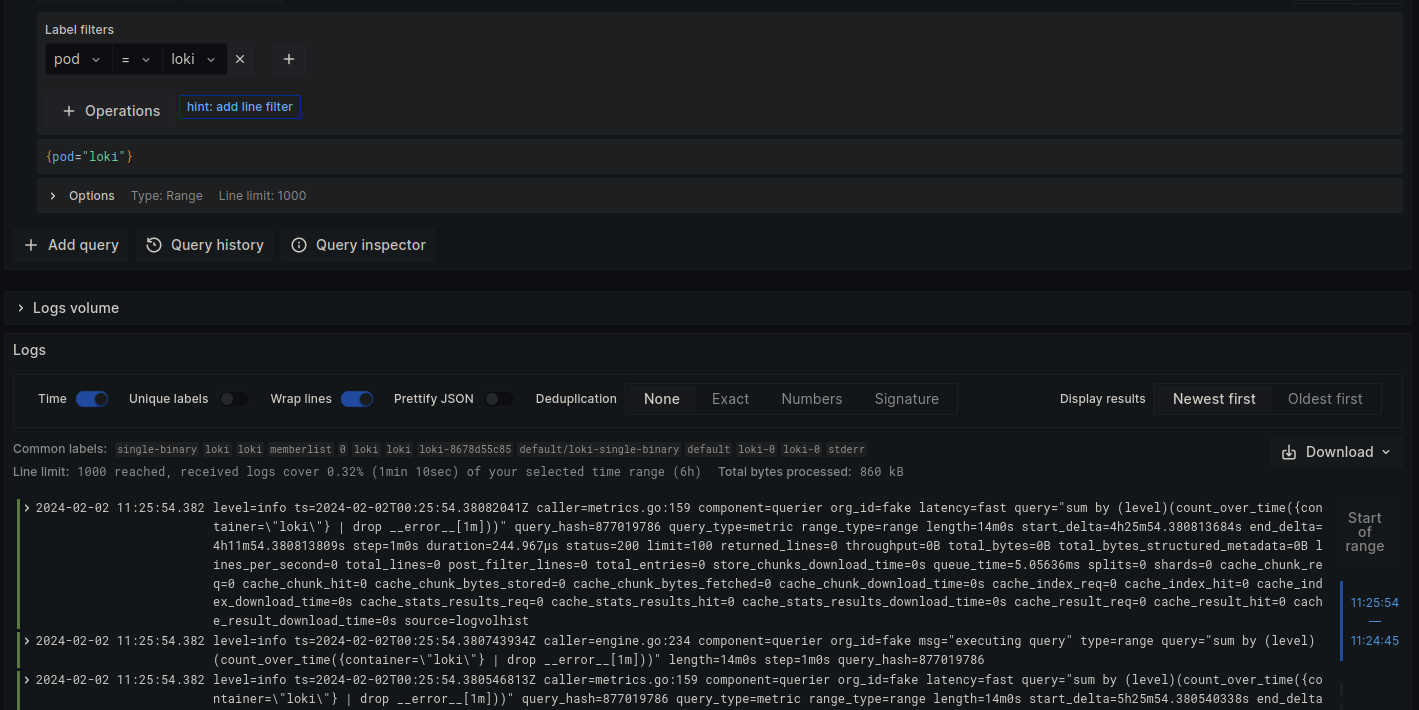
{pod="loki"}

The result of the query above will show logs from the Loki pods:

That's it! Now that Loki is running in your cluster, you can experiment with advanced configurations like increasing the replica numbers, switching the storage backend to other providers like AWS S3, and customizing Loki's label scraping configuration.

Learn how to manage K8s costs via the Kubecost APIs

Best practices

Adopting best practices when using Grafana Loki ensures optimal log management, performance, and cost-effectiveness in your logging infrastructure. Whether you're deploying Loki in a small-scale environment or at scale in production, these guidelines can help you get the most out of Loki.

Use structured logging

Implementing structured logs when using Grafana Loki is helpful for several reasons. When log messages are consistently formatted, applying label metadata to log streams is easier. Query filtering can be done with JSON parsing, and log format consistency across services enables easier log processing and transformations, like exporting critical log messages for auditing purposes. Committing all services in a Kubernetes cluster to a consistent log format is better than allowing each service to have its own unique log format, thereby introducing complexity when attempting to query these logs.

Here is an example of a plain-text unstructured log message. Performing log queries on this type of data is computationally expensive because the entire message must be scanned for matches:

2024-02-05 12:00:00 ERROR User login failed for user_id=1234 due to incorrect password

A better approach is to use a JSON structured log format:

{
  "timestamp": "2024-02-05 12:00:00",
  "level": "ERROR",
  "message": "User login failed for user_id=1234 due to incorrect password",
  "user_id": 1234,
  "error_reason": "incorrect password"
}

The log queries can now filter by specific JSON keys like “error_reason” without performing a full scan on all the text. LogQL performance will be significantly faster by indexing the “error_reason” metadata label, and full-text searches can now be avoided.

Log selectively

Not all log messages will provide value and have relevance for analysis like troubleshooting. A best practice to improve the cost efficiency and performance of Grafana Loki is to avoid unnecessary logging and only keep log output, which may be valuable in the future. Blindly storing all logs generated by an entire Kubernetes cluster will be costly and cause performance penalties for Loki.

Similarly, implement log retention policies to automatically prune stale logs and avoid storing logs indefinitely, except logs that are relevant for long-term archival (such as for auditing purposes). Loki supports configuration fields like “retention_period” to delete old logs automatically. The project also supports implementing multiple retention policies that apply to different log streams, allowing administrators to discard low-value logs while retaining logs that may be required for long-term archival.

Optimize log labels

Loki's performance and storage requirements are closely tied to using metadata labels. Administrators should avoid unnecessarily applying labels and instead carefully curate their use. Indexing the most valuable labels for querying will help maintain performance requirements. A typical log message may only have a subset of fields that contain commonly queried data, which are the fields for which labels will be valuable for indexing. Over-indexing log data with too many labels will reduce the advantage that Loki provides with index-free logging.

Optimize scaling

Loki exposes dozens of Prometheus metrics for all its components, allowing administrators to gain insight into performance bottlenecks and the sources of various potential issues. Regularly evaluating the metrics will help administrators detect potential resource exhaustion or scaling issues, particularly when Loki handles high log volume.

Loki natively provides automatic scaling features that can be enabled in the Loki Helm chart values.yaml file. Administrators can configure fields related to min/max replicas, target CPU/memory utilization, and scaling sensitivity. These fields provide input into HorizontalPodAutoscaler (HPA) resources that the Loki Helm chart can automatically create based on the provided values.yaml file.

Here is an example snippet of some Loki values available to configure related to autoscaling behavior:

replicas: 3
  autoscaling:
	enabled: false
	minReplicas: 2
	maxReplicas: 6
	targetCPUUtilizationPercentage: 60
	targetMemoryUtilizationPercentage:
	behavior:
  	    scaleUp:
    	        policies:
      	     - type: Pods
        	       value: 1
        	       periodSeconds: 900


A full example of a Loki values.yaml file and descriptions of each parameter can be found on GitHub.

Log security

Logs will often contain sensitive information that must be secured. Loki supports multi-tenancy controls, and Grafana supports an RBAC system, which should be leveraged to control user access to log data. The backend storage system (like AWS S3) should also be secured via native security controls like bucket access policies and object encryption. Maintaining the security of log data is a crucial aspect of the overall security posture of a Kubernetes cluster.

Implement a multi-faceted observability setup

Grafana Loki does not provide a full observability solution for Kubernetes clusters. Logging is a critical aspect of observability but must be complemented with other observability data to provide a complete overview of a cluster's operations. Metrics and cost allocation data are required for a comprehensive observability setup.

A multi-faceted approach to observability will require administrators to consider additional tools alongside Loki, such as Prometheus for metrics collection and Kubecost for Kubernetes cost monitoring.

Prometheus provides valuable metrics collection functionality and integrates easily with Grafana dashboards and Loki, while Kubecost extends observability by enabling financial metrics for administrators to gain insight into cluster cost breakdowns and spend optimization opportunities. Ensuring that a Kubernetes cluster has observability implemented from multiple angles ensures that administrators have complete insight into their clusters and can effectively conduct troubleshooting, incident analysis, performance optimization, and cost optimization.
Conclusion

Grafana Loki is a valuable project providing a modern log aggregation approach for Kubernetes administrators. Its unique features, like native integration with Kubernetes and the Prometheus/Grafana stack, index-free logging, and scalability, enable many use cases for cluster administrators looking for a simple and effective logging tool.

Experimenting with Loki in your Kubernetes cluster will familiarize you with how the tool is configured and how logs are visualized in Grafana; it will also show you whether the tool easily meets your logging requirements. Some best practices are essential to remember, such as determining when to scale Loki with additional replicas and learning how to approach a labeling strategy. Administrators looking for a modern and scalable approach to logging will find Loki to be a valuable addition to their existing observability stacks alongside other tools like Prometheus for metrics collection and Kubecost for cost analysis.

Comprehensive Kubernetes cost monitoring & optimization

Continue reading this series