Learn about the essential metrics for effectively monitoring with Azure Kubernetes Service (AKS) and how it provides insights for optimization and troubleshooting in a rapidly growing and innovative cloud computing industry.

AKS Monitoring for Insights and Optimization

The Azure Kubernetes Service (AKS) is emerging as a leader in managing containerized applications. As a result of global businesses relying on containerized applications in AKS, effective monitoring is critical.

Kubernetes monitoring is not just about observing the systems; it’s about gaining meaningful insights to drive decision-making and continuous improvement. From tracking the state of your nodes and pods to monitoring CPU usage and network traffic, AKS monitoring provides the comprehensive visibility needed to ensure your applications run smoothly and efficiently.

This article will explain the essential metrics required for effective AKS monitoring. We’ll explore how these metrics can help you understand the state of your AKS environment and how they can be used to identify potential issues before they impact your applications.

Summary of key AKS monitoring concepts

The table below summarizes data types that are essential to AKS monitoring.

Monitoring data type Description
Platform metrics Automatically collected performance metrics for AKS clusters, including CPU and memory usage.
Activity logs Logs that track cluster events, such as cluster creation, configuration changes, and resource provisioning.
Resource logs Control plane logs for AKS, capturing information on API server requests, node updates, and cluster operations.
Container insights Logs and performance data collected from containers, including application logs, stdout/stderr streams, and resource utilization are stored in a Log Analytics workspace and Azure Monitor Metrics.
Security Monitoring for security vulnerabilities and compliance focuses on protecting the AKS cluster from threats and ensuring adherence to security best practices.

Azure AKS monitoring and observability

Azure AKS provides a comprehensive monitoring and observability solution to help you gain insights into your AKS clusters' health, performance, and security. This solution leverages Azure Monitor, a unified monitoring platform that collects and analyzes data from various sources, including AKS clusters, virtual machines, and applications.

Key components of Azure AKS monitoring and observability

The sections below describe the four critical components of Azure AKS monitoring and observability.

Azure Monitor for containers

This native Azure service comprehensively monitors AKS clusters, including metrics, logs, and traces. It collects data from the Kubernetes control plane and kubelet. This data is then sent to Azure Monitor for analysis and visualization.

Azure log analytics

This centralized log management service collects, and stores logs from various sources, including AKS clusters, applications, and infrastructure. It provides powerful search and analytics capabilities to identify patterns, troubleshoot issues, and ensure compliance.

Azure application insights

This application performance management (APM) service provides deep insights into the performance and health of your applications running on AKS. It collects application logs, traces, and metrics to identify performance bottlenecks, exceptions, and errors.

Azure dashboards

Azure Monitor provides a flexible dashboarding capability to create customized views of your monitoring data. Experts can combine data from various sources, including AKS clusters, applications, and infrastructure, to create a comprehensive overview of a system's health and performance.

Understanding AKS monitoring data types

Effective AKS monitoring requires a thorough understanding of the different types of data it generates. These data types provide valuable insights into cluster health, performance, and resource utilization, enabling informed decisions for optimizing and troubleshooting your AKS environment. Let's explore the key categories of AKS monitoring data and their significance in maintaining a robust and efficient cluster.

Platform metrics in AKS monitoring

In Azure Kubernetes Service (AKS), monitoring the performance metrics of your clusters is fundamental for ensuring optimal operations. AKS automatically gathers platform metrics, offering insights into the health and efficiency of your Kubernetes environment.

Metrics collection

AKS clusters automatically gather platform metrics without incurring additional charges. These metrics can be examined using Metrics Explorer or employed to trigger metric-based alerts. It leverages a combination of built-in Kubernetes monitoring features and Azure's monitoring capabilities to collect a range of metrics:

  • CPU utilization: Tracks the percentage of CPU resources utilized across the cluster nodes. High CPU usage might indicate resource contention or the need for optimization.

AKS monitoring Metrics: showcases cluster CPU usage in millicores.

  • Memory usage: Monitors the memory consumption across the nodes. Identifying memory-intensive workloads or potential leaks is vital for maintaining stability.

AKS monitoring Metrics: showcases cluster average memory usage in MB

  • Disk Utilization: Disk Utilization metrics offer visibility into storage usage on the node or cluster. High disk utilization may suggest a need for additional storage or a cleanup of unnecessary data.

AKS monitoring Metrics: showcases diskusedPercentage on a specific node

For a granular view, utilize available filters to focus on individual nodes or the entire cluster. Adjust the time range settings to explore historical data, aiding in identifying usage patterns or irregularities in disk usage over specific periods.

Accessing platform metrics from Azure Kubernetes Service (AKS) using Azure CLI

The Azure CLI provides a convenient way to retrieve platform metrics from AKS clusters. Developers can utilize the az command to access these metrics and gain insights into the performance of your AKS environment.

Comprehensive Kubernetes cost monitoring & optimization

In the example below, the command fetches the CPU usage metric from the specified AKS cluster within a one-minute interval. This is particularly useful for monitoring the CPU utilization of the cluster.

Note that the examples below use the Azure(az) CLI. You can find more information on the Azure CLI on its documentation page.

az monitor metrics list --resource-type Microsoft.ContainerService/managedClusters --resource <resource-group>/<aks-cluster-name> --metric CPUUsage --interval 1m --output table

Adjust the --metric, --interval, and --output parameters to fetch different metrics, change the time intervals, or modify the output format based on specific monitoring requirements.

Sample output:

StartTime                      EndTime                        TimeGrain      CPUUsage
------------------------------ ------------------------------ -------------- ----------
2023-12-13T08:00:00+00:00      2023-12-13T08:01:00+00:00      PT1M           0.62
2023-12-13T08:01:00+00:00      2023-12-13T08:02:00+00:00      PT1M           0.78
2023-12-13T08:02:00+00:00      2023-12-13T08:03:00+00:00      PT1M           0.91
2023-12-13T08:03:00+00:00      2023-12-13T08:04:00+00:00      PT1M           0.75
2023-12-13T08:04:00+00:00      2023-12-13T08:05:00+00:00      PT1M           0.58

By leveraging these automatically collected metrics and visualization tools, AKS users can proactively manage and optimize their clusters for enhanced performance and reliability. REST APIs are also available for users who require them for specific use cases such as automation, etc.

Activity logs

Activity logs are a crucial component of Azure Kubernetes Service (AKS) monitoring. They provide a comprehensive record of events and actions within the cluster. These logs are automatically collected and stored in Azure Monitor, offering valuable insights into cluster operations, configuration changes, and potential security threats.

Users can access these logs through the Azure portal, Azure CLI, or Azure Monitor REST API. These logs can answer questions like “Who created this cluster?” or “When was this configuration changed?”.

Types of Logged Activities

  • Cluster Creation and Deletion: Activity logs capture the initiation and termination phases of the AKS cluster.
  • Configuration Changes: Any modifications made to the cluster's configuration, such as scaling node pools, updating network settings, or adjusting authentication mechanisms, are logged.
  • Resource Provisioning: Activities related to cluster resource provisioning, including deployments, pod creations, and service integrations, are recorded.

Accessing activity logs

To access the activity log, navigate to the "Activity Log" section within the Monitor menu in the Azure portal. The initial filter of the activity log is determined by the menu from which it is accessed.

The screen will typically show a list of activities such as resource creation, deletion, updates, and other operational events, along with details like the time of occurrence, the user or service principal performing the action, and the status of the activity. You can further refine this view by adding filters based on specific properties or timeframes.

Azure activity log snapshot records virtual machine creation and updates, tracking recent system changes.

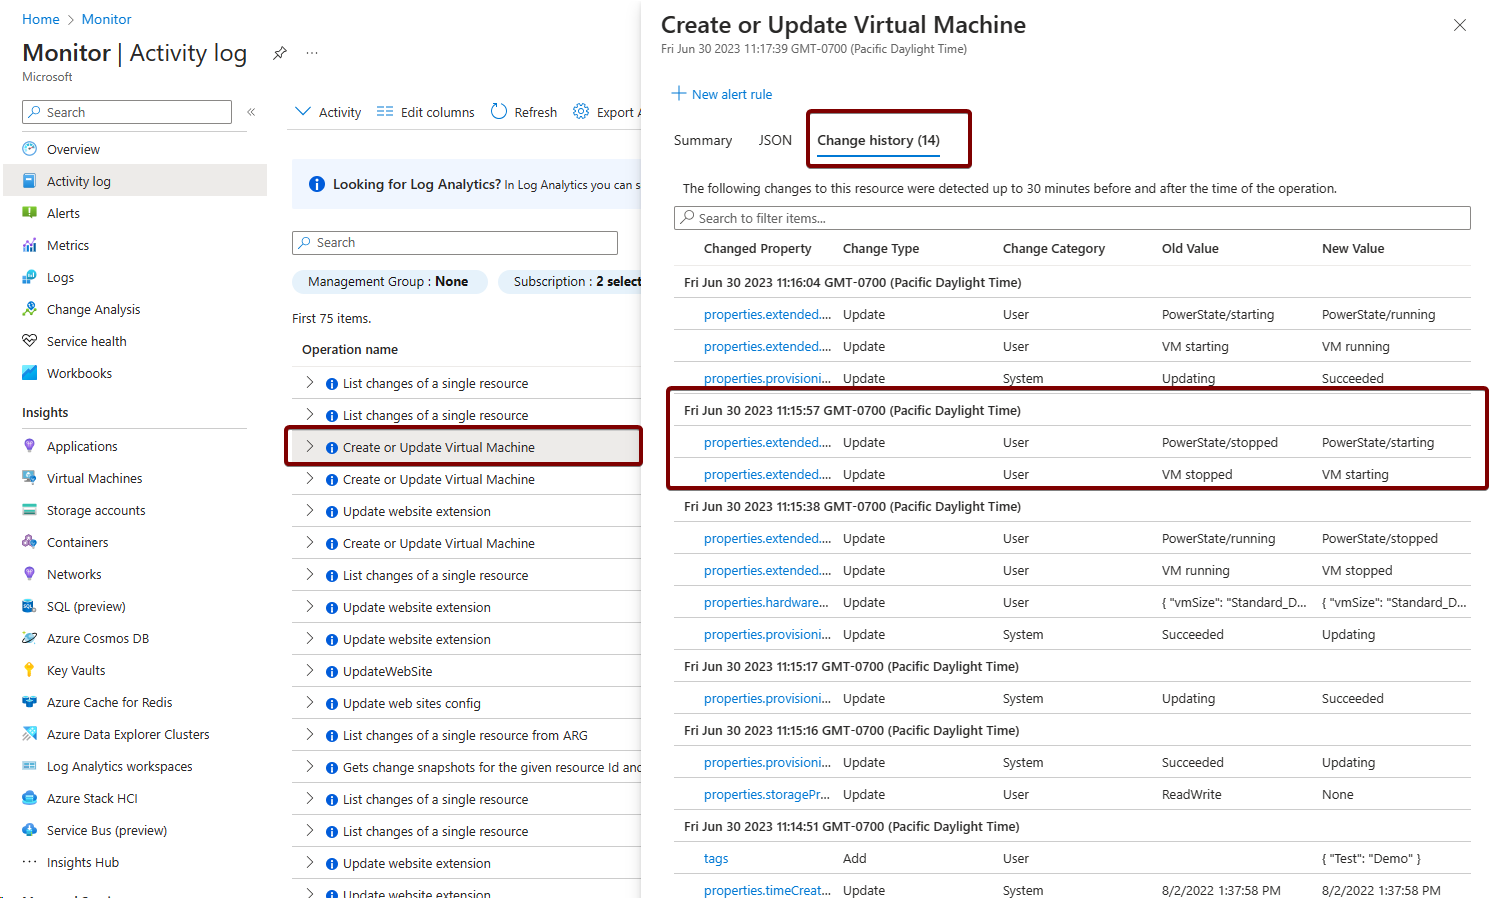
This activity log snapshot demonstrates the creation and updates of virtual machines in Azure. Highlighted are the key events of 'create or update virtual machine' alongside the corresponding change logs, showcasing instances when the VM was stopped and started

Activity logs in AKS monitoring play a vital role in maintaining an audit trail and understanding the sequence of actions performed on the cluster. This information is valuable for tracking changes, diagnosing issues, and maintaining organizational policies and standards compliance.

Retrieving activity logs for Azure Kubernetes Service (AKS) using Azure CLI

Azure CLI offers another streamlined approach to accessing Activity Logs. The az monitor activity-log list command facilitates the retrieval of these logs, providing insights into various activities performed within the AKS cluster.

az monitor activity-log list --resource <resource-group>/<aks-cluster-name> --output table

The command fetches the Activity Logs associated with the specified AKS cluster in the provided example.

Sample Output:

Time                          Resource ID                                         OperationName                            Status

2023-12-01T09:23:45.0000000Z  /subscriptions/abcd1234-ab12-cdef-5678-abcdef123456  Microsoft.Compute/virtualMachines/start  Succeeded
2023-12-02T11:47:21.0000000Z  /subscriptions/abcd1234-ab12-cdef-5678-abcdef123456  Microsoft.Compute/virtualMachines/stop   Succeeded
2023-12-03T10:15:32.0000000Z  /subscriptions/abcd1234-ab12-cdef-5678-abcdef123456  Microsoft.Compute/virtualMachines/start  Succeeded

These logs contain information about various actions performed within the cluster, including resource creation, deletion, updates, and other operational events. The --output table parameter formats the logs into a tabular layout for better readability.
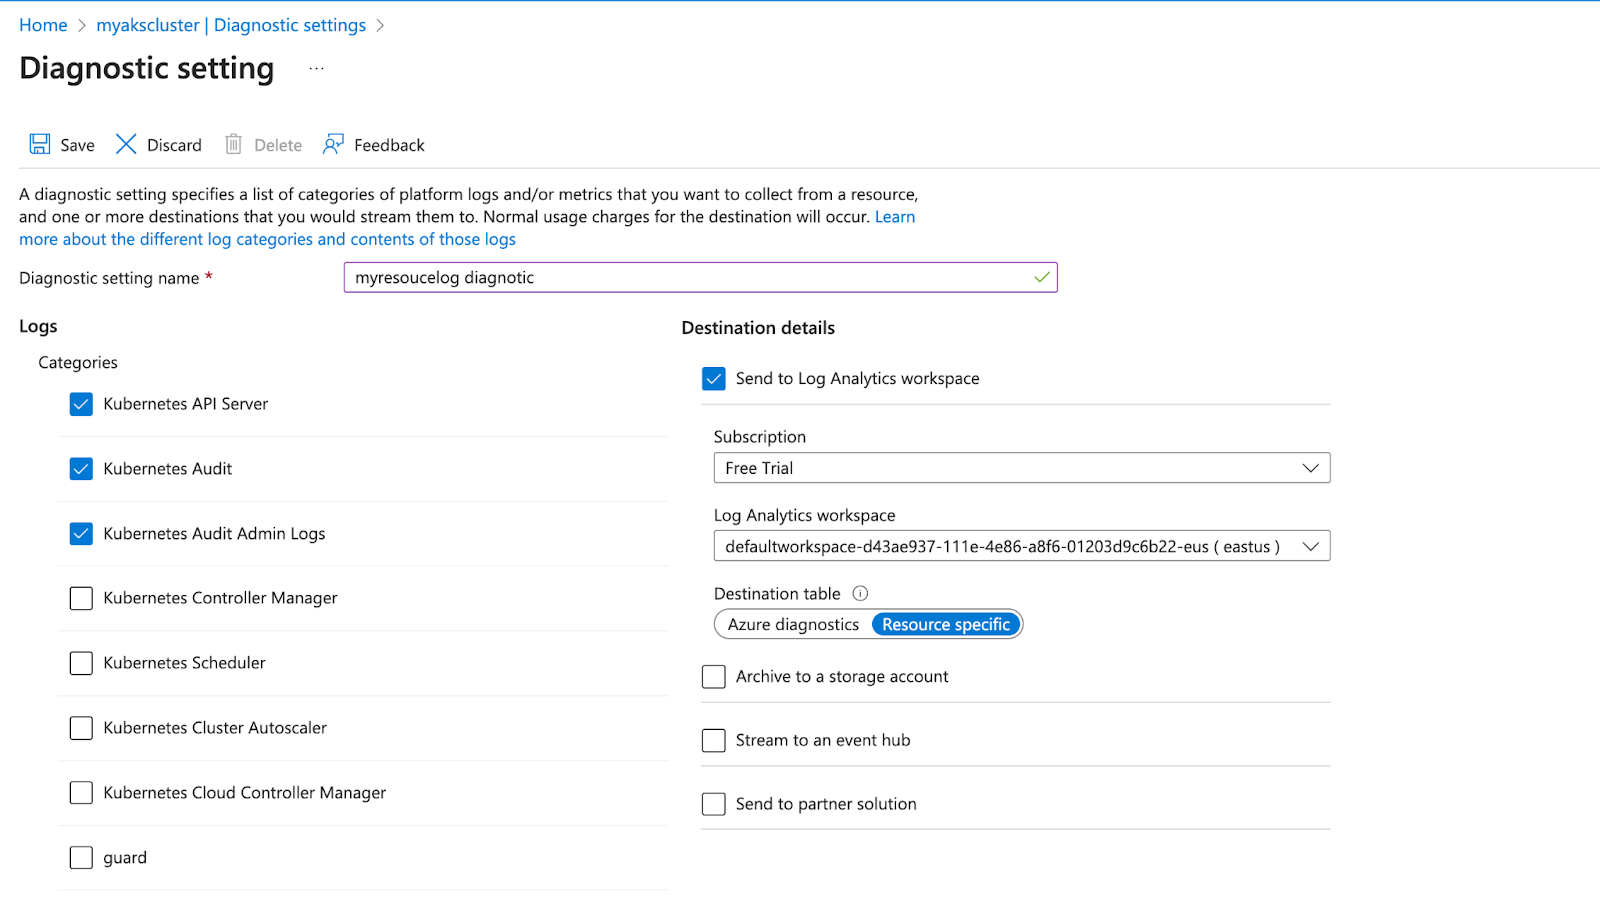
Resource logs

Resource logs, also known as control plane logs, are another vital part of AKS monitoring. They capture detailed information about the operations and events occurring within the AKS control plane, including API server requests, node updates, and other cluster operations.

These logs can help you understand the internal workings of your AKS cluster and can be instrumental in troubleshooting issues. For instance, if a node fails to join the cluster, the resource logs might provide insights into what caused the failure.

It's essential to highlight that resource logs remain uncollected until directed to a specific destination. For every Azure resource, a unique diagnostic setting is necessary, outlining the following criteria:

  • Sources: Determines the specific metric and log data to transmit to the predefined destinations. The available types differ based on the resource type.
  • Destinations: Specifies one or multiple locations where the data is sent.

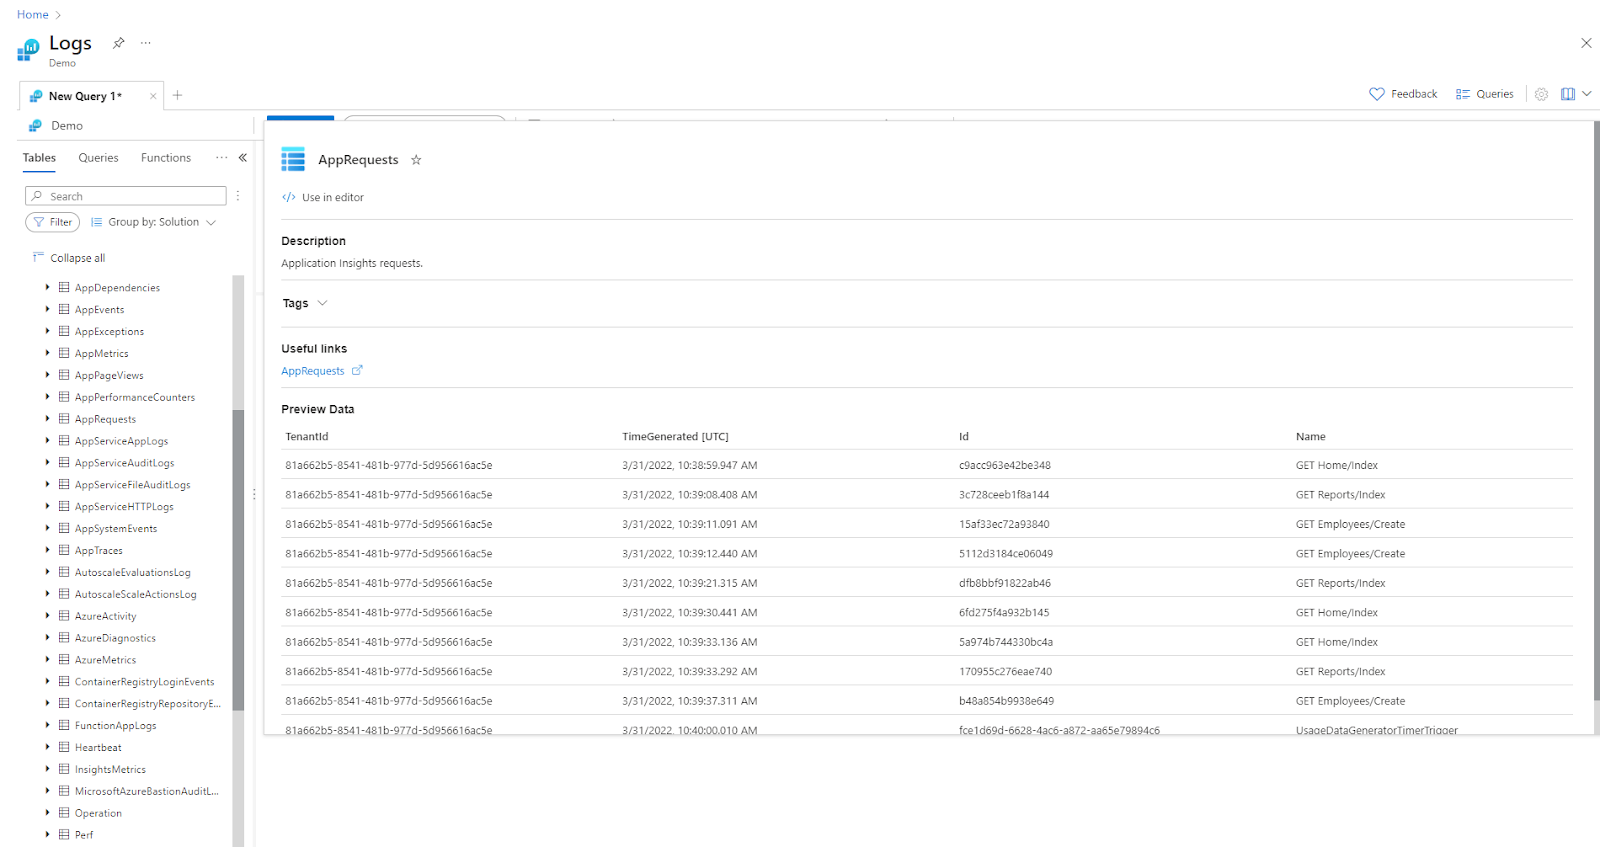
For example, after setting up a diagnostic configuration to route specific logs to a Log Analytics workspace, users can then use Azure Monitor's Log Analytics to query and analyze the logs produced by the AKS control plane.

Screenshot showcasing the setup of diagnostic settings, focusing on routing data effectively from its source to the intended destination for comprehensive monitoring.

K8s clusters handling 10B daily API calls use Kubecost

Screenshot showcasing the Azure Monitor log insight page.

Users can configure diagnostic settings to manage and route these logs to various destinations, including storage accounts, Event Hubs, etc.

Logged information

  • API server requests: Details of all requests made to the Kubernetes API server, including CRUD (Create, Read, Update, Delete) operations on resources like pods, services, deployments, and namespaces.
  • Node updates: Information regarding changes and updates to the cluster nodes, such as node additions, removals, or configuration modifications.
  • Cluster operations: Records of various cluster-level operations, such as scaling node pools, applying network policies, and managing RBAC (Role-Based Access Control) configurations.

Additionally, one can utilize the Azure CLI to enable resource logs. Here is an example illustrating how resource logs can be enabled:

az monitor diagnostic-settings create \
  --resource-group myResourceGroup \
  --name myDiagnosticSetting \
  --target-resource myResource \
  --logs "[
    {
      "category": "AllLogs",
      "enabled": true,
      "retentionPolicy": {
        "enabled": true,
        "days": 30
      }
    }
  ]"

This command will create a diagnostic setting named “myDiagnosticSetting” for the resource “myResource” in the resource group “myResourceGroup”.

The diagnostic setting will collect all logs for the resource and retain them for 30 days.

Container insights

Container insights is a feature of Azure Monitor that provides comprehensive monitoring of container workloads deployed to Azure

Container Insights in AKS provides comprehensive visibility into containerized workloads, offering access to logs and performance metrics crucial for monitoring and managing applications running within the cluster.

Types of Data Collected

  • Application logs: Captures logs generated by applications running within containers, aiding in application-level troubleshooting, debugging, and monitoring.
  • Standard streams (stdout/stderr): Collects the standard output and error streams from containers, providing real-time insights into the behavior and status of running applications.
  • Resource utilization metrics: Gathers metrics related to CPU usage, memory consumption, network traffic, and disk I/O at the container level, aiding in performance analysis and optimization.

Accessing container insights for an AKS cluster

Container Insights in the Azure portal can be accessed by going to the 'Containers' section under the 'Monitor' menu or directly selecting 'Insights' from the chosen AKS cluster.

Container Insights screenshot showcases four diagrams, offering in-depth analytics on container performance and resource utilization.

The default page opens and displays four performance line charts that show key performance metrics of the cluster. This includes:

  • Node CPU utilization: Tracks CPU usage across cluster nodes.
  • Node memory utilization: Monitors memory usage on cluster nodes.
  • Node count: This shows the number of nodes in the Kubernetes cluster.
  • Active pod counts: Displays the count of actively running pods in the cluster.

Container Insights screenshot showcases container health status

View AKS resource live logs

The Live Data feature within Container Insights enables real-time monitoring of your AKS containers. It provides live access to container logs (stdout/stderr), events, and pod metrics, effectively exposing functionality similar to kubectl logs -c, kubectl get events, kubectl top pods, etc.

To view the live logs for pods, deployments, replica sets, stateful sets, daemon sets, and jobs with or without Container insights from the AKS resource view:

  1. In the Azure portal, browse the AKS cluster resource group and select your AKS resource.
  2. Select “Workloads” in the Kubernetes resources section of the menu.
  3. Select a pod, deployment, replica set, stateful set, daemon set, or job from the respective tab.
  4. Select” Live Logs” from the resource's menu.
  5. Select a pod to start collecting the live data.

Screenshot showcasing live logs functionality(source)

Learn how to manage K8s costs via the Kubecost APIs

Container Insights in AKS empowers users to effectively monitor containerized workloads, diagnose issues, and optimize resource utilization. By leveraging this feature, administrators gain valuable visibility into container behavior, facilitating efficient management and maintenance of applications running within the Kubernetes environment.

Security monitoring

Security monitoring is an essential aspect of managing AKS clusters. Developers can proactively identify and address potential threats by continuously monitoring Kubernetes clusters for security vulnerabilities and compliance, ensuring applications and data protection.

Threat detection

Effective security monitoring for AKS involves continuous detection and analysis of potential threats. This entails monitoring various sources of data, including:

  • Container Images: Scanning container images for known vulnerabilities and malware before deployment.
  • Kubernetes API Server Logs: Auditing Kubernetes API server logs to identify suspicious activity or unauthorized access attempts.

Vulnerability management

Vulnerability management is a critical component of security monitoring for AKS. It involves identifying, assessing, and prioritizing vulnerabilities in your containerized applications and underlying infrastructure. This process typically includes:

  • Vulnerability scanning: Regularly scanning container images and AKS components for known vulnerabilities.
  • Vulnerability assessment: Evaluate the severity and potential impact of each identified vulnerability.

Compliance Adherence

Compliance adherence ensures that AKS clusters adhere to industry standards and regulatory requirements. This may involve:

  • Implementing compliance controls: To meet specific compliance requirements, such as access control policies and data encryption.
  • Continuous monitoring for compliance: Continuously monitor AKS clusters for compliance violations and address any discrepancies.
  • Compliance auditing: Regularly conducting audits to verify compliance with applicable standards and regulations.

Leveraging built-in AKS security features

The following details some of AKS' strategies for monitoring security and vulnerabilities:

  1. Microsoft Defender for Cloud: A cloud-native security solution that provides comprehensive security capabilities for AKS clusters, including:
    • Vulnerability scanning: Scans container images and AKS components for known vulnerabilities.
    • Threat detection: Monitors for suspicious activity and unauthorized access attempts.
    • Security management: Provides real-time threat protection for clusters and nodes, generating security alerts for suspicious activities.
  2. Container Image Security: Azure Container Registry (ACR) scanning capabilities help detect vulnerabilities in container images before deployment, reducing the risk of potential exploits.

Challenges in AKS monitoring

Despite its effectiveness in maintaining the health and performance of Kubernetes clusters, AKS monitoring has certain limitations that should be considered. These include:

Complex setup:

Setting up AKS monitoring involves configuring Azure Monitor, Log Analytics, and AKS Diagnostics for cluster, node, and application monitoring. This encompasses defining metrics, alerts, and log collection across these levels to ensure comprehensive oversight

Regional limitations of Azure Monitor

The disparities in Azure Monitor's regional accessibility pose significant challenges for monitoring efforts. Variations in availability across regions, differences in feature sets, and potential data latency issues hinder the uniformity and depth of monitoring insights. This inconsistency affects applications spanning multiple regions, leading to fragmented monitoring and hampered troubleshooting. Additionally, compliance constraints in certain regions restrict the scope of monitoring data, impeding comprehensive oversight of application performance across the Azure landscape.

For example, monitoring in Europe and North America provides comprehensive insights. At the same time, the absence of some features of Azure Monitor in Asia might create monitoring blind spots, hindering effective tracking and troubleshooting of that region's application performance or issues.

Table displaying Azure Monitor's regional accessibility. (here)

Limited visibility into application-specific metrics

AKS monitoring primarily focuses on infrastructure-level metrics such as CPU utilization, memory consumption, and network traffic. While these metrics provide valuable insights into overall cluster health, they may not provide the granular visibility required to troubleshoot application-specific performance issues. For example, you may need additional tools to collect and analyze application logs or performance metrics.

Limitation with live logs from private clusters

While AKS monitoring provides valuable insights into cluster health and performance, accessing live logs from private clusters poses a challenge. Since private clusters are isolated from the public network, direct access to their logs is restricted to machines within the cluster's private network. This limitation can hinder remote monitoring efforts and may require additional network configurations to enable access from external locations.

To address this limitation, consider utilizing alternative monitoring solutions that support remote access to private clusters. These solutions may employ techniques such as VPN connections or dedicated proxy servers to establish a secure connection to the private network, enabling real-time log monitoring from remote locations.

Six strategies for optimizing AKS monitoring

The effectiveness of AKS clusters in supporting containerized applications relies heavily on robust monitoring and management practices. To enhance AKS monitoring and ensure optimal performance, consider implementing these six essential strategies below. Each strategy will include a list of tips to help you get started.

Utilize Azure Monitor for comprehensive monitoring

Azure Monitor helps users gain a comprehensive overview of their environments. Integrating Azure Monitor with AKS monitoring can help centralize key monitoring information.

Here are three tips to help you get started with Azure Monitor:

  • Enable Azure Monitor Agent: Install and configure the Azure Monitor Agent on all AKS nodes to collect and send metrics, logs, and events from the nodes, pods, and containers running on your cluster.
  • Create Diagnostic Settings: Create diagnostic settings to route logs and metrics from AKS resources to Azure Monitor logs and metrics workspaces. This allows for centralized storage, analysis, and alerting.
  • Utilize Azure Monitor Views and Dashboards: Create customized views and dashboards in Azure Monitor to visualize and analyze monitoring data effectively. This provides a comprehensive overview of your cluster's health and performance.

Integrate container insights for container-specific monitoring

Visibility into containers is essential for observability. Container insights provides container-level visibility. To get started, follow these steps:

  • Enable container insights: Enable container insights, an Azure Monitor add-in, to collect and analyze container-specific logs and metrics. This provides deep insights into container health, performance, and resource utilization.
  • Configure container insights data collection: Configure container insights data collection to collect the relevant logs and metrics for your monitoring needs. This ensures that applications are not collecting unnecessary data, reducing storage costs and improving performance.
  • Utilize container insights workbooks and alerts: Leverage container insights workbooks and alerts to analyze and act on container-specific monitoring data. Workbooks provide visualizations and insights, while alerts notify you of potential issues.

Use log analytics for efficient log management

Azure Log Analytics helps teams derive insights from log data. You can integrate Log Analytics with your AKS monitoring by following these steps:

  • Create log analytics workspace: Create a Log Analytics workspace in Azure to store and analyze logs from AKS resources. This workspace provides centralized log management and search capabilities.
  • Configure log analytics data collection: Configure log collection from AKS resources to send logs to the Log Analytics workspace. This enables centralized storage and analysis of all logs.
  • Utilize log analytics queries and alerts: Use Log Analytics queries to analyze and extract insights from logs. Create alerts based on log queries to be notified of potential issues or suspicious activity.

Implement Azure Sentinel for security monitoring

Azure Sentinel is a cloud-based security information and event management (SIEM) solution from Microsoft Azure. It's also known as Microsoft Sentinel. It provides a comprehensive solution for collecting, analyzing, and responding to security events across your organization. Azure Sentinel uses machine learning to identify anomalies and patterns in security data that may indicate a potential threat.

Here's a structured approach to using Azure Sentinel in conjunction with AKS monitoring:

  • Connect Azure Sentinel to AKS: Connect Azure Sentinel to your AKS cluster to centralize security monitoring and threat detection. Azure Sentinel provides advanced security analytics and incident response capabilities.
  • Utilize Azure Sentinel security policies: Create security policies in Azure Sentinel to detect and respond to potential security threats. These policies can trigger alerts, initiate investigations, and automate remediation actions.
  • Monitor Azure Sentinel logs and alerts: Continuously monitor Azure Sentinel logs and alerts to identify potential security incidents. Promptly investigate and respond to security alerts to minimize the impact of potential breaches.

Conclusion

Effective AKS monitoring is crucial for maintaining the health and performance of containerized applications. Azure Monitor is a comprehensive and unified platform for collecting, analyzing, and visualizing AKS clusters' metrics, logs, and alerts. By utilizing Azure Monitor, organizations can proactively identify potential issues, optimize resource utilization, and ensure the seamless operation of their Kubernetes environments.

However, when selecting a monitoring solution, it is essential to consider factors such as the organization's specific needs, budget, and existing infrastructure. By carefully evaluating available options, organizations can choose a solution that aligns with their requirements and effectively supports their Kubernetes deployments.

Further, Azure Monitor lays a solid groundwork for AKS monitoring, some organizations might benefit from exploring advanced monitoring solutions that delve deeper into cost optimization and resource utilization, offering specialized capabilities beyond basic health checks. These tools can complement Azure Monitor by identifying complex patterns, predicting potential outages, and providing granular visibility into application behavior.

Comprehensive Kubernetes cost monitoring & optimization

Continue reading this series