Keep on top of your Kubernetes cluster by learning about the best practices in monitoring.

Kubernetes Monitoring Best Practices

In cloud-native deployments, monitoring and observability are critical to ensuring exceptional workload performance and high availability. As the leading container orchestration platform, Kubernetes requires a well-thought-out monitoring strategy to navigate its inherent complexity and deliver the best possible user experience. As organizations increasingly adopt microservices and distributed architectures, practical monitoring tools and methodologies become even more essential.

This blog post aims to cover the following:

  • Explaining the importance of monitoring and observability in Kubernetes environments
  • Offering actionable insights and practical advice on implementing best practices
  • Providing hands-on examples and real-world scenarios to demonstrate the application of these best practices
  • Empowering DevOps and SRE engineers with the knowledge to make informed decisions about their monitoring strategies, tools, and processes

By understanding and implementing the concepts and practices outlined in this blog post, you'll be better equipped to manage, optimize, and troubleshoot your Kubernetes clusters, ensuring their reliability and resilience in complex, dynamic environments.

Summary of key Kubernetes monitoring best practices concepts

The table below summarizes the key concepts related to Kubernetes monitoring best practices that this article will explain in more detail.

Concept Summary
Important Concepts Related to Kubernetes Monitoring
  • What is Monitoring?
  • What is Observability?
  • Difference between Monitoring and Observability
Best practices for Kubernetes monitoring
  • Implementing a comprehensive monitoring strategy
  • Ensuring accurate and timely data collection
  • Utilizing practical visualization tools and dashboards
  • Establishing proactive alerting and incident response
Deploy a Kubernetes Cluster for a Practical Demonstration
  • AWS EKS Cluster creation
  • Install the required tools and deploy kube-prometheus-stack
Key metrics to monitor in Kubernetes
  • Cluster-level metrics
  • Node-level metrics
  • Pod and container-level metrics
  • Application-specific metrics
How can you choose the correct monitoring tools for your Kubernetes environment?
  • Assessing your monitoring needs
  • Comparing popular Kubernetes monitoring tools
  • Ensuring compatibility and integration with your existing toolset

Important Kubernetes monitoring concepts

Before diving into Kubernetes monitoring best practices, let’s review the fundamental concepts of monitoring and observability.

What is monitoring?

Monitoring collects, analyzes, and displays data about your systems and applications' performance, availability, and health. It allows you to identify trends, detect anomalies, and uncover potential issues before they escalate into major problems. In a Kubernetes environment, monitoring gathers metrics from various components, such as nodes, pods, containers, and custom application metrics.

What is observability?

Observability is a broader concept that goes beyond traditional monitoring. It refers to the ability to understand the internal state of a system or application by examining its external outputs, such as logs, metrics, and traces. Observability lets you gain deeper insights into your systems and applications, helping you diagnose issues more effectively and optimize performance. In the context of Kubernetes, observability includes collecting logs, monitoring metrics, and implementing distributed tracing for a more comprehensive view of your environment.

Difference between monitoring vs. observability

While monitoring and observability share common goals, such as maintaining system health and performance, the two have fundamental differences. The table below summarizes these differences.

Characteristic Monitoring Observability
Scope Focuses on predefined metrics and known issues It aims to provide insights into unknown issues and the overall behavior of the system
Proactivity Often reactive, it relies on predefined thresholds and alerts to identify problems Encourages a more proactive approach, enabling investigation without prior assumptions
Depth Provides a high-level view of the system It gives a deeper understanding of the internal workings by correlating logs, metrics, and traces

Four essential Kubernetes monitoring best practices

The following sections explore four essential Kubernetes monitoring best practices necessary to ensure optimal workload performance and availability.

Implement a comprehensive monitoring strategy.

Include all layers:

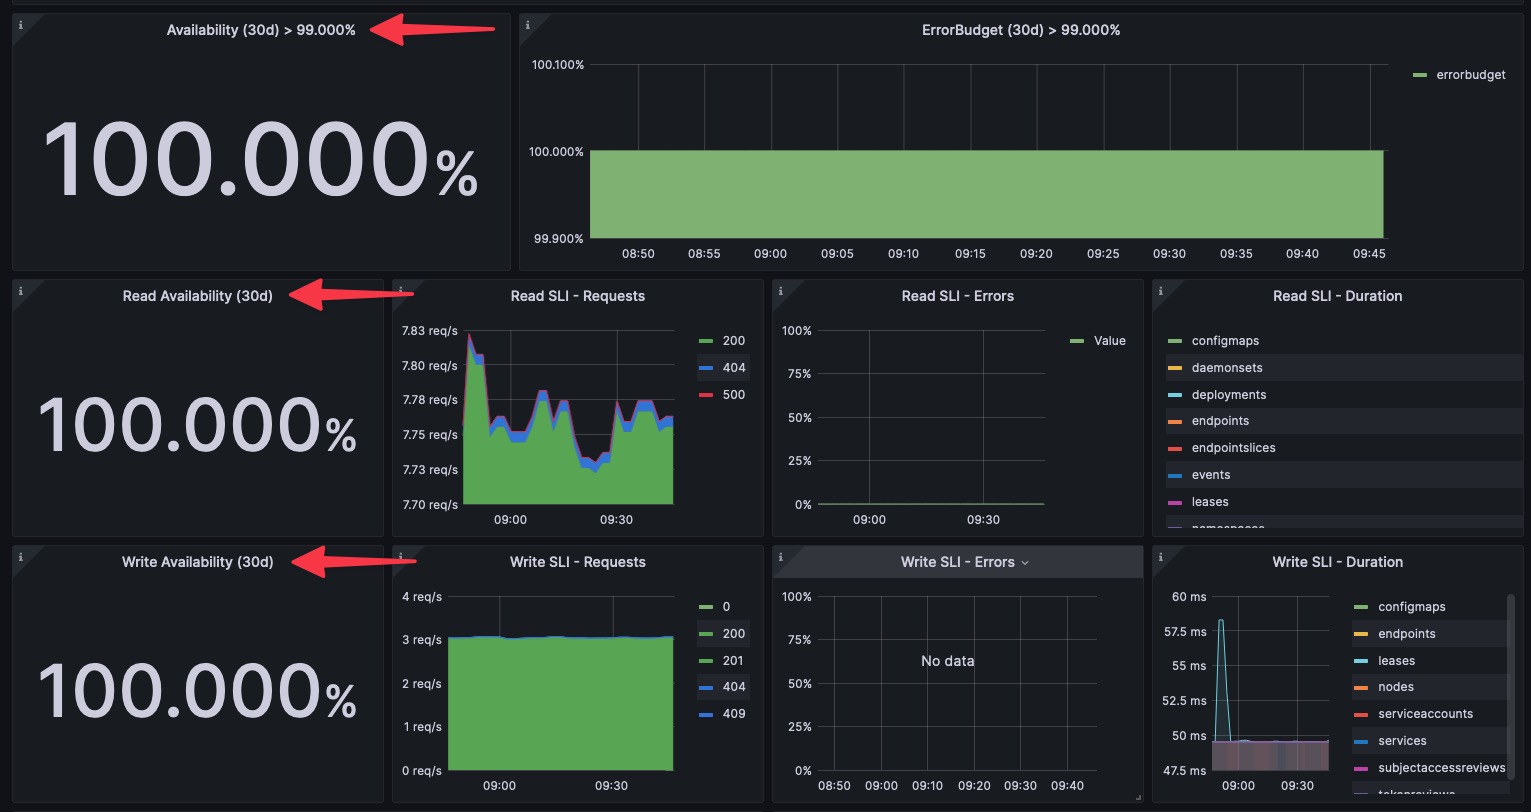
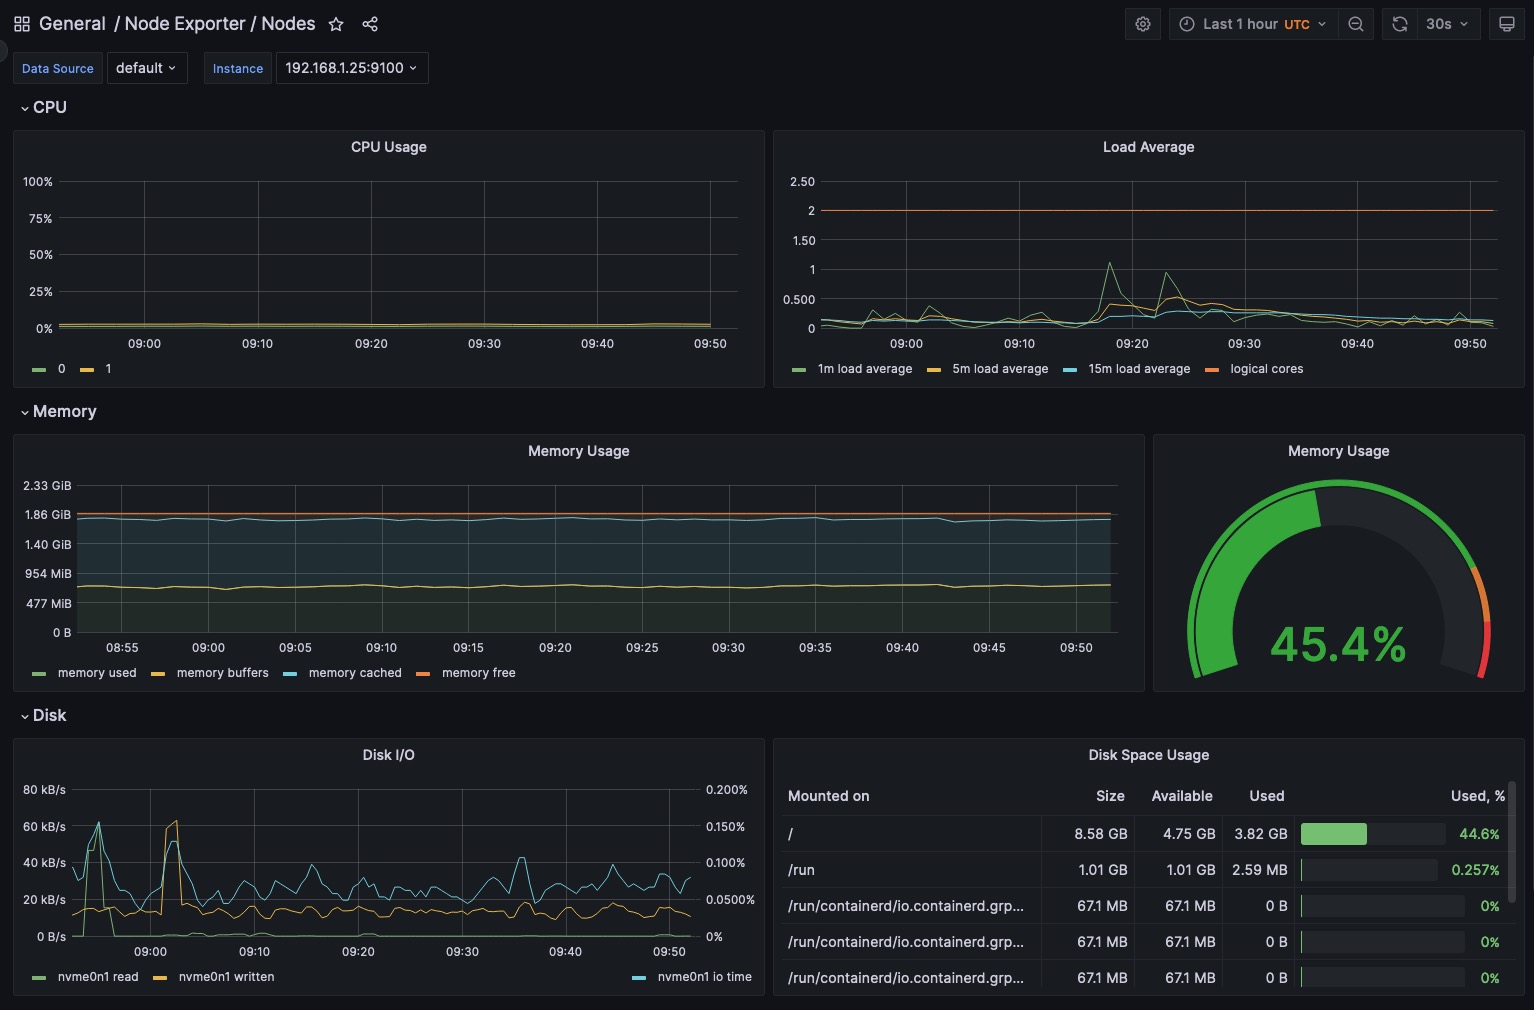
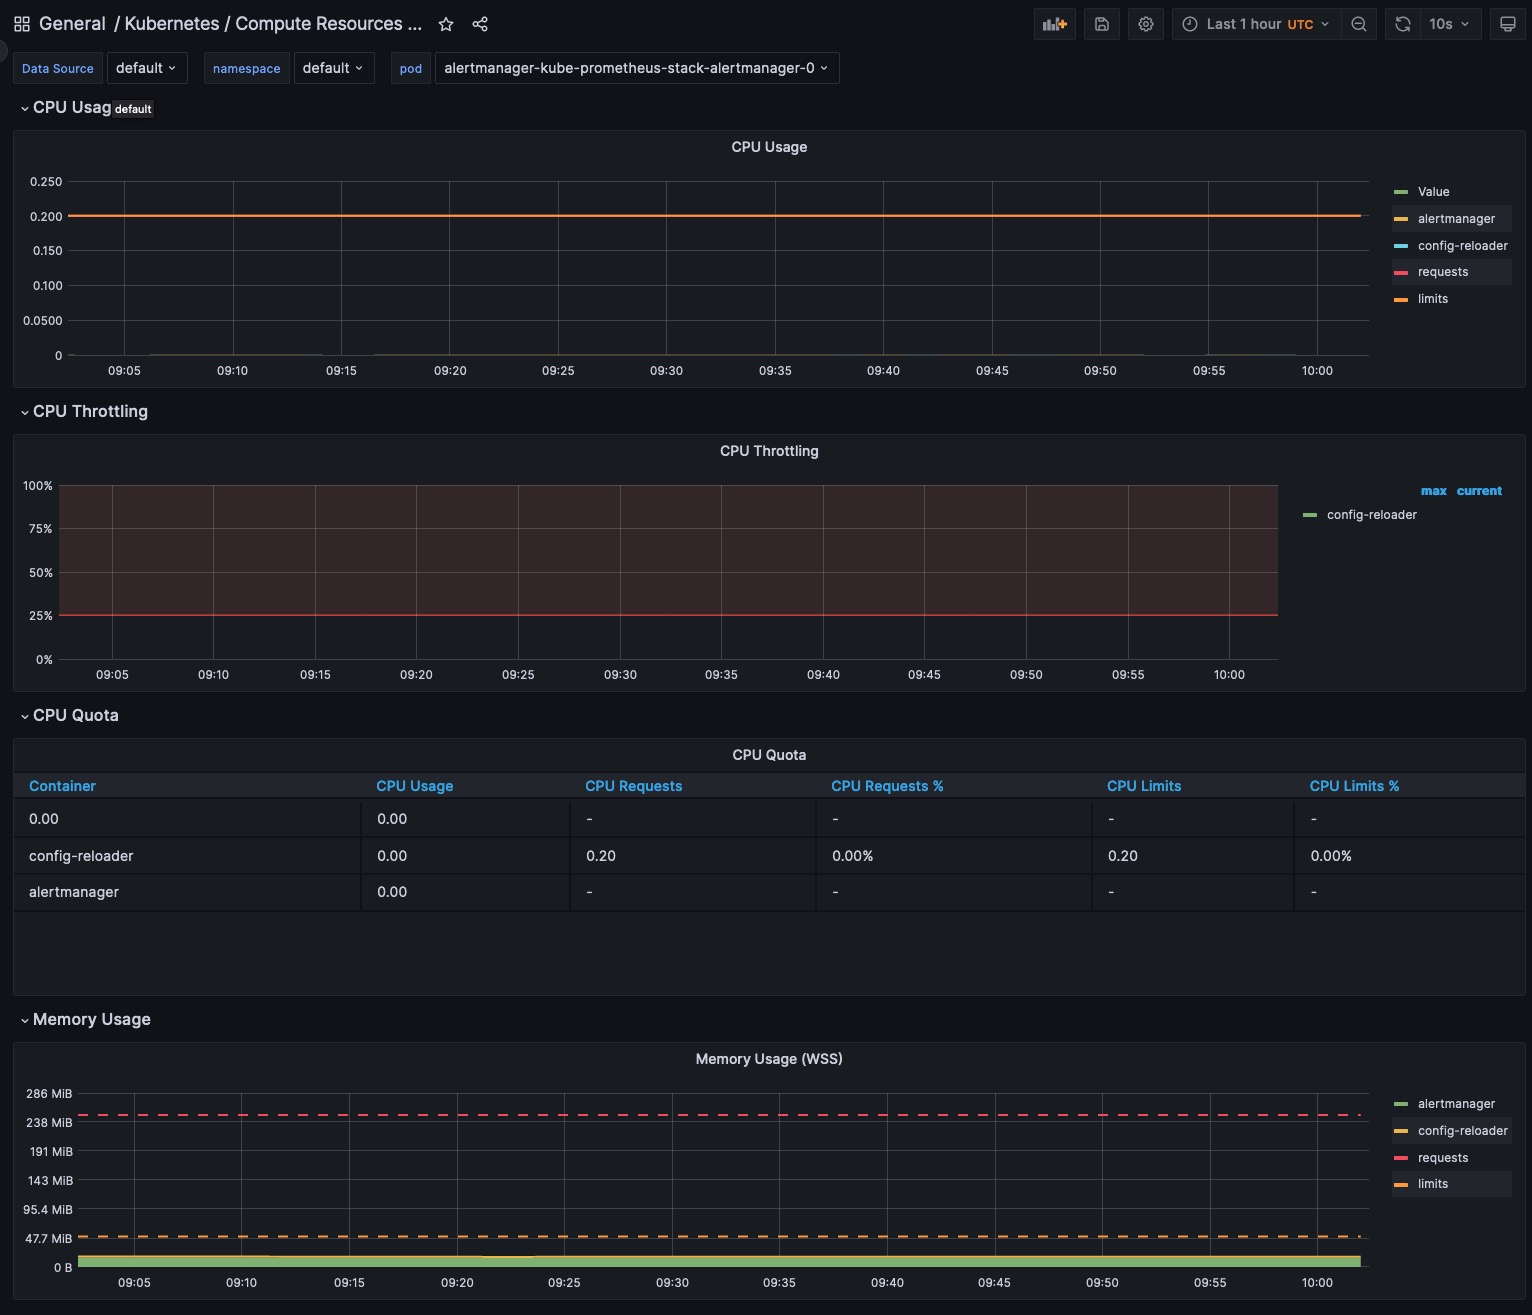
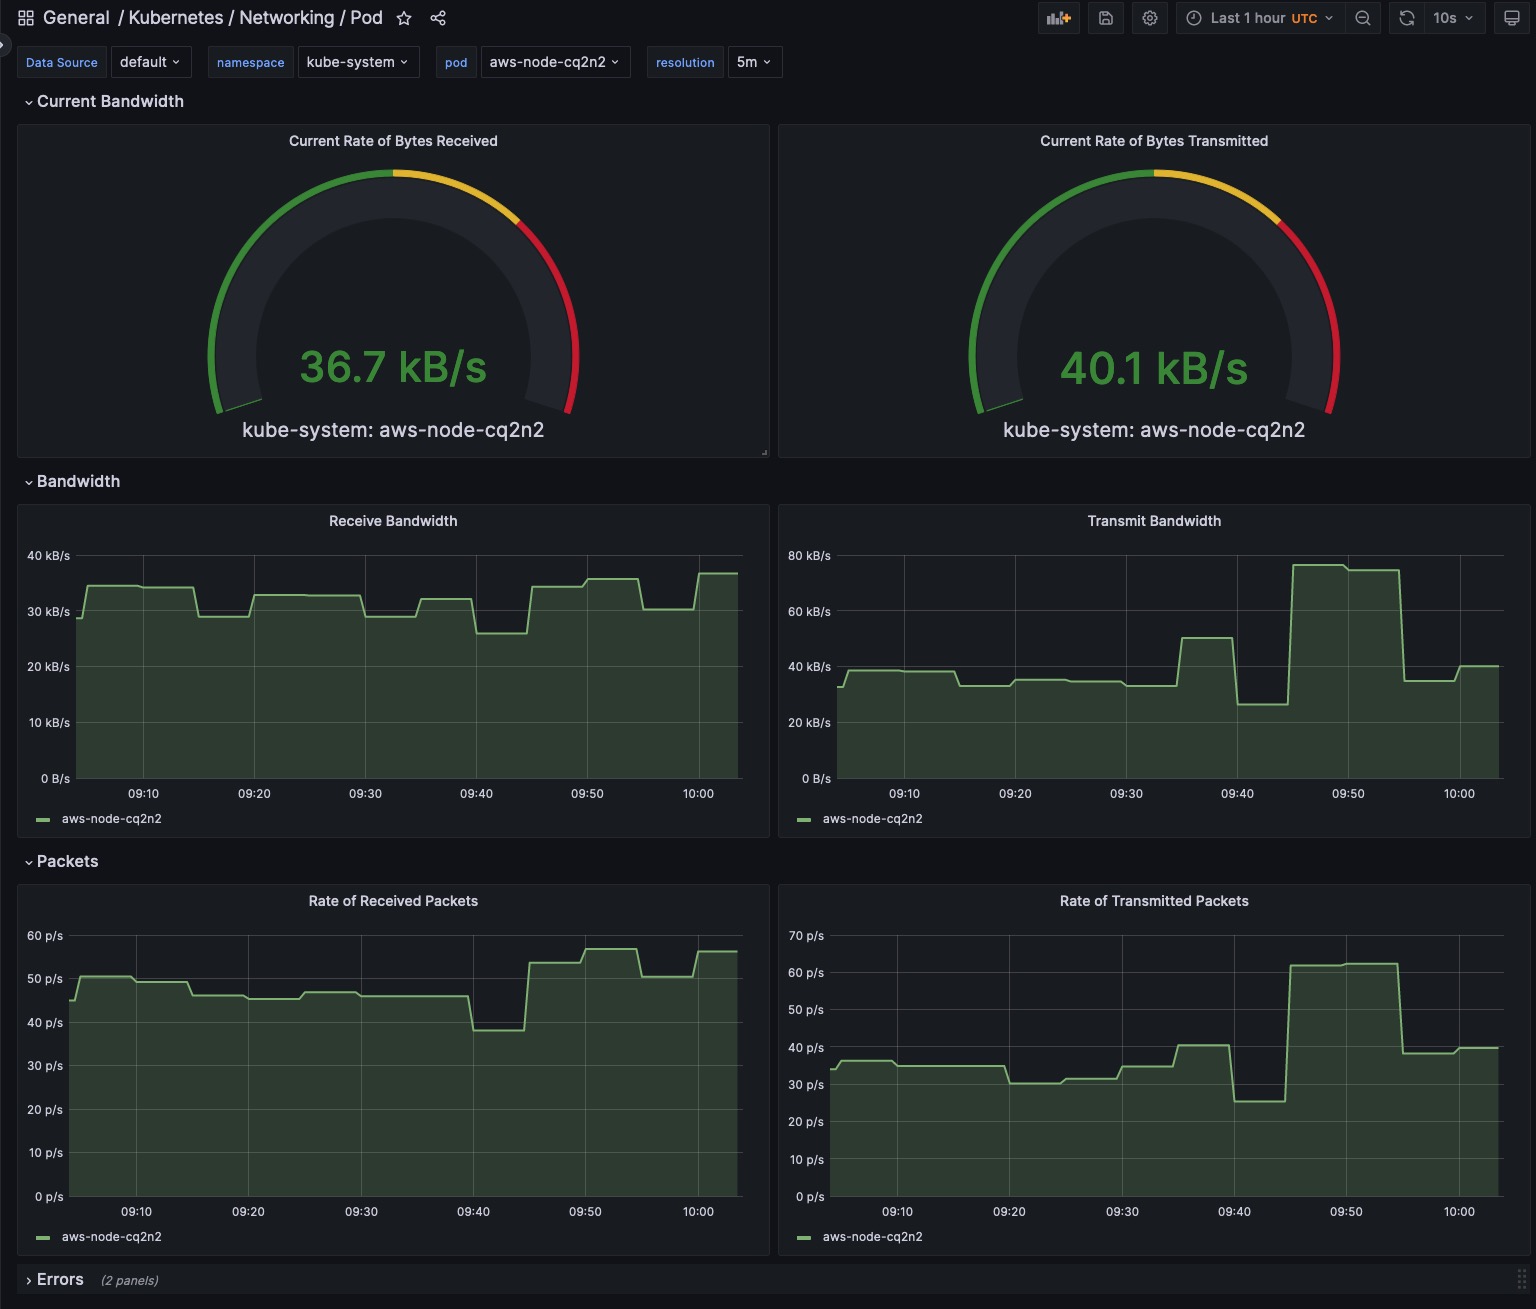
Your monitoring strategy should cover every layer: infrastructure, platform, and application-level metrics. For instance, infrastructure metrics like node CPU or memory usage, platform metrics such as Kubernetes events or errors, and application metrics such as request count or error rate. This holistic approach provides an end-to-end view of your environment, enabling data-driven decisions and proactive issue resolution. Observing all layers lets you quickly pinpoint whether an issue originates from the infrastructure, the platform, or the application itself.

Address cluster-wide and granular metrics:

Collect and analyze metrics at the cluster level (e.g., cluster state, resource availability) and more granular levels (e.g., node-level resource usage, pod status). For instance, monitoring node-level metrics can swiftly identify a spike in CPU usage at a specific node, enabling faster issue mitigation. This combination of comprehensive and granular focus helps uncover system-wide patterns and individual discrepancies, allowing you to optimize resource usage and mitigate issues early.

Ensure accurate and timely data collection.

Configure metric scraping intervals:

Adjusting Prometheus metric scraping intervals to suit your environment's needs is crucial. For example, a microservices application with fluctuating workloads might require shorter scraping intervals for near real-time insights. Nevertheless, the increased system overhead caused by more frequent scraping should be considered and balanced against your monitoring requirements. Regular, reliable data collection is vital to an effective monitoring strategy.

Verify metric accuracy through validation checks:

Implement validation checks to verify the accuracy and consistency of collected metrics. For instance, cross-verifying system CPU usage metrics with process-level CPU usage metrics ensures data consistency and validity. These steps help avert false alarms, ensure data reliability, and provide confidence in your system analysis and decision-making processes.

Establish proactive alerting and incident response.

Define alert thresholds and escalation policies:

Setting alert thresholds based on your environment's requirements is essential. For example, you might set an alert threshold at 80% CPU usage if a particular pod consistently peaks at this level. You should also define Escalation policies alongside immediate notifications to the monitoring team if critical alerts are not addressed promptly. Effective alert management helps avoid system downtime and promotes efficient incident response.

Integrate with incident management tools:

Connecting your monitoring solution with tools like PagerDuty or OpsGenie enhances the incident response process. For instance, critical alerts could automatically create incidents in these tools, notifying the relevant team and triggering the incident resolution process. This integration simplifies alert management, reduces manual effort, and improves system reliability.

Utilize cluster cost monitoring tools.

Integrate Kubecost into your monitoring solution to track and optimize the cost of running your Kubernetes clusters. Kubecost can provide insights into resource usage per namespace, pod, container, and/or labels, helping identify inefficiencies, such as underutilized resources that you could downsize to save costs. This cost monitoring enhances financial visibility and promotes cost-effective resource management.

Combining Kubecost with your existing monitoring tools gives you a comprehensive understanding of your Kubernetes environment's performance and cost-related aspects.

This overview includes monitoring metrics and cost information, enabling informed resource management and cost control decisions. It leads to more efficient operations and aids in maintaining a balance between performance and cost-effectiveness.

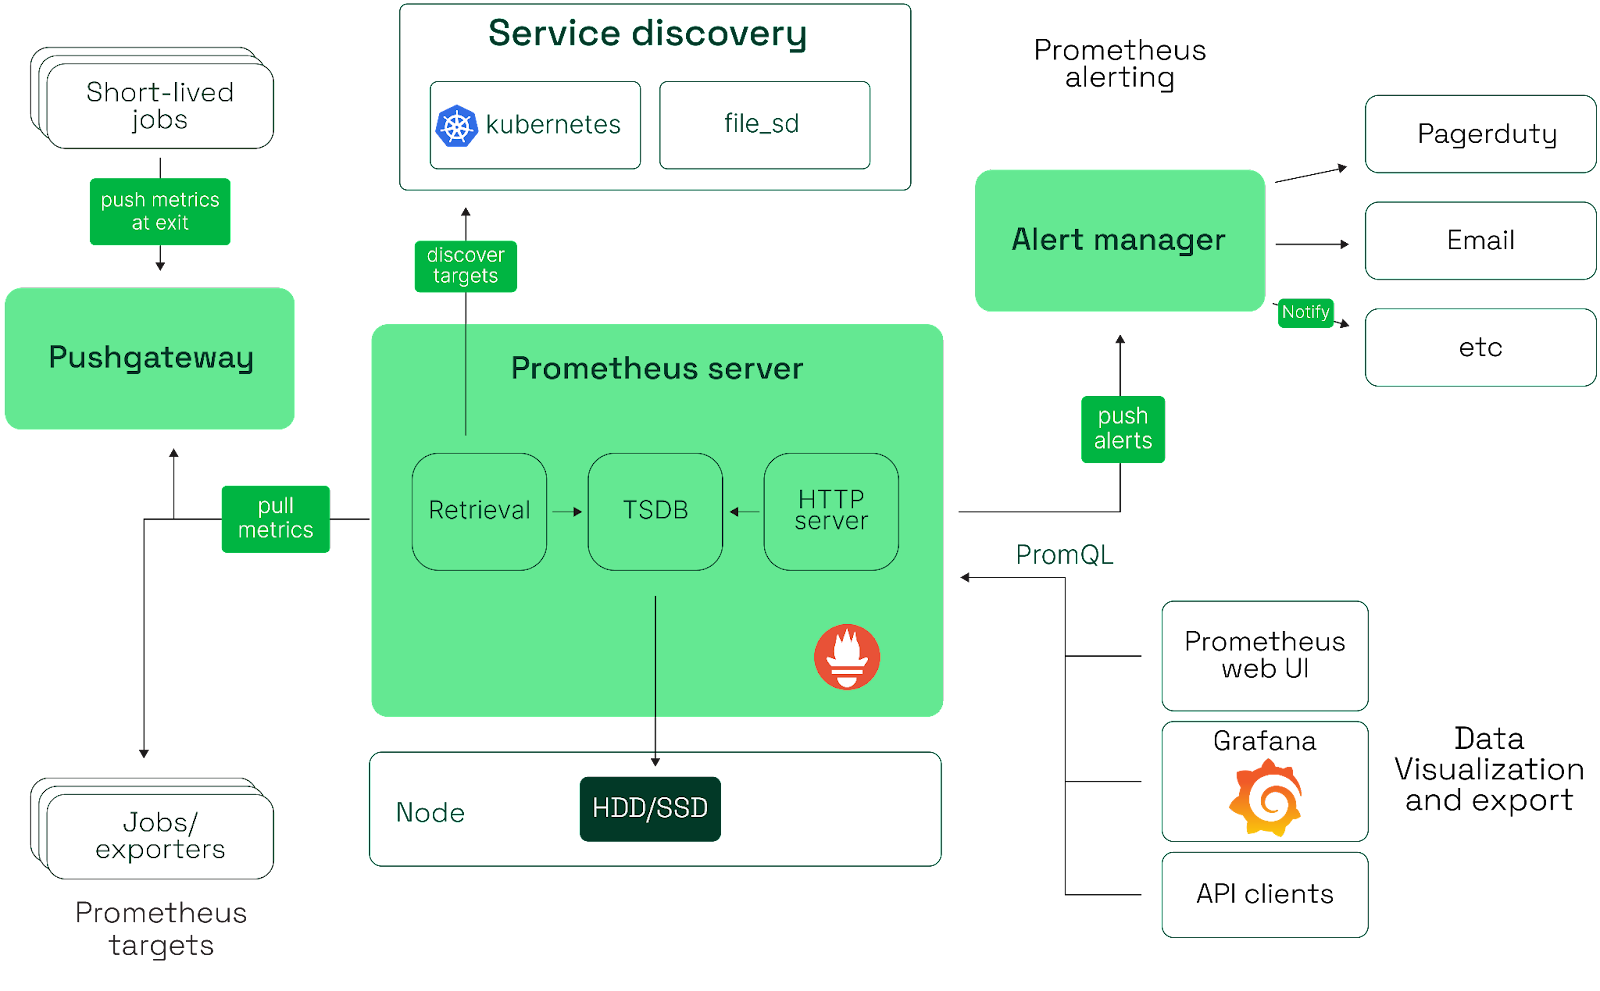
The instructions for integrating with Prometheus are provided here.

Comprehensive Kubernetes cost monitoring & optimization

Deploy a Kubernetes Cluster for a Practical Demonstration

To demonstrate Kubernetes monitoring tools, we will use Amazon Elastic Kubernetes Service (AWS EKS) as a Kubernetes Cluster for practical deployments and usage of tools. Other alternatives for creating clusters would be Kind, minikube, and K3s; which allows you to deploy Kubernetes clusters locally. You can also use these tools if you are familiar with these options.

Running AWS EKS for this demo will incur a small amount of cost. To avoid these costs, you can use the above alternative tools.

To follow this tutorial, you’ll need:

Deploying AWS EKS Cluster

To create an AWS EKS cluster, we will use eksctl tool. To create the EKS resources, create a cluster.yaml file with the below configuration.

apiVersion: eksctl.io/v1alpha5
kind: ClusterConfig

metadata:
  name: eks-monitoring
  region: us-east-1

iam:
  withOIDC: true

managedNodeGroups:
  - name: node-group-1-spot-instances
    instanceTypes: ["t3.small", "t3.medium"]
    spot: true
    desiredCapacity: 3
    volumeSize: 8

addons:
  - name: vpc-cni
  - name: coredns
  - name: aws-ebs-csi-driver
  - name: kube-proxy

This file defines the configuration for creating an AWS EKS cluster named eks-monitoring in the us-east-1 region. The metadata section specifies the name of the cluster and the AWS region where it will be deployed. Additionally, the iam section enables the cluster's OpenID Connect (OIDC) provider to use IAM roles for Kubernetes service accounts.

The configuration file also includes a managed node group called node-group-1-spot-instances consisting of spot instances, a cost-effective option for running your workloads. The node group uses a mix of t3.small and t3.medium instance types, with a desired capacity of three nodes and a volume size of 8 GB for each node. The addons section lists the necessary components for the cluster, such as the VPC CNI plugin, CoreDNS for service discovery, the AWS EBS CSI driver for dynamic provisioning of EBS volumes, and Kube-proxy for managing network traffic between pods and services.

To apply the configuration, execute the command:

> eksctl create cluster -f cluster.yaml

This will create an EKS cluster with a node group consisting of a single node in the us-east-1 region. Once the cluster is ready, you should see an output similar to the one below.

2022-09-05 18:47:47 [✔]  EKS cluster "eks-monitoring" in "us-east-1" region is ready.

We must update the kubeconfig file with newly created cluster access to interact with the cluster. To update the kubeconfig, execute the command.

> aws eks --region us-east-1 update-kubeconfig --name eks-monitoring

To confirm the cluster access, get the Pods from the default namespace, execute the command:

> kubectl get pods

No resources found in default namespace.

As we are just verifying the cluster access, No resources found is an expected response from a new cluster.

Deploying kube-prometheus-stack helm chart

For a practical demonstration of various metrics, we will use Kube-prometheus-stack. Kube-prometheus-stack is a robust open-source stack designed for monitoring Kubernetes clusters, which comes pre-built with Prometheus, Alertmanager, and Grafana components. The kube-prometheus-stack provides built-in dashboards that offer a rich set of metrics, which we can leverage to visualize the health of Kubernetes and all its applications.

fig. Prometheus Architecture (Source)

Get Helm repository info

First, to add and update the helm repository of kube-prometheus-stack, execute the below command:

> helm repo add prometheus-community https://prometheus-community.github.io/helm-charts

> helm repo update

Install Helm Chart

Now, we can install kube-prometheus-stack chart in our above-created cluster.

> helm install kube-prometheus-stack prometheus-community/kube-prometheus-stack
K8s clusters handling 10B daily API calls use Kubecost

After successful installation, you should get output similar to the below one.

NAME: kube-prometheus-stack
LAST DEPLOYED: Mon Apr 17 13:02:53 2023
NAMESPACE: default
STATUS: deployed
REVISION: 1
NOTES:
kube-prometheus-stack has been installed. Check its status by running:
  kubectl --namespace default get pods -l "release=kube-prometheus-stack"

Access Grafana dashboards

To access the pre-built Grafana dashboards, execute the below commands.

  • To get the login password for Grafana, execute:
    ❯ kubectl get secret kube-prometheus-stack-grafana -o jsonpath="{.data.admin-password}" | base64 --decode ; echo
  • To access the dashboards, execute:
    kubectl port-forward svc/kube-prometheus-stack-grafana 3000:80
  • Now, you can visit http://localhost:3000 to login to Grafana. The default username is admin, and the password will be the value returned from the previous command.

Access Prometheus GUI

To access the pre-built Prometheus GUI, execute the below command.

kubectl port-forward svc/kube-prometheus-stack-prometheus 9090:9090

Now, you can visit http://localhost:9090 to get default Prometheus GUI.

We will explore these Grafana dashboards as we progress throughout the article.

What are the key metrics to monitor in Kubernetes?

Cluster-level metrics

Cluster-level metrics provide an overview of the overall health and performance of your Kubernetes cluster. By monitoring these metrics, you gain insights into the state of your cluster and detect potential issues that may affect its stability and performance.

API server latency

The API server is the central control plane component that exposes the Kubernetes API. Monitoring its latency helps you understand how quickly the API server processes and responds to requests. High latency may indicate performance bottlenecks or excessive load on the API server, leading to slow response times and reduced efficiency in cluster operations.

To view this metric in the deployed cluster and using kube-prometheus-stack,

  1. Once logged in to Grafana, search for the API Server dashboard.
  1. Scroll down, click on Work Queue Latency, and view it.

If your average API server latency increases significantly, you may need to investigate the root cause. Potential reasons for increased latency include insufficient resources allocated to the API server, increased requests due to cluster growth, or issues with the underlying infrastructure.

API server availability

API server availability measures the percentage of time the API server is operational and able to handle requests. Monitoring API server availability is crucial for ensuring the reliability and stability of your Kubernetes cluster. A low availability rate may indicate problems with the API server, such as crashes or network issues, which can impact the functionality of your cluster and its ability to manage workloads.

To view this metric:

  • You should see availability metrics on the API Server dashboard.

If your API server availability rate drops below the defined threshold, you may need to investigate the root cause. Some possible reasons for reduced availability can include issues with the control plane components, network problems between the API server and other cluster components, or resource constraints affecting the API server's performance.

Node-level metrics

These metrics provide insights into the performance and resource usage of individual nodes in your cluster:

CPU and memory usage

Monitoring your nodes' CPU and memory usage helps you understand resource consumption and identify potential bottlenecks or resource constraints. High CPU or memory usage may indicate resource scaling or optimization needs.

Use Grafana dashboards to visualize CPU and memory usage trends over time and set up alerts for usage exceeding predefined thresholds, e.g., 80% of the total capacity.

Learn how to manage K8s costs via the Kubecost APIs

Disk space and I/O

Tracking disk space and I/O metrics helps you identify potential storage issues or bottlenecks that could affect application performance or lead to data loss.

Monitor disk space usage and alert when available disk space falls below a defined threshold, e.g., 20% of total capacity. Also, monitor I/O throughput and latency to identify potential storage performance issues.

These metrics are available on the General / Node Exporter / Nodes dashboard.

Pod and container-level metrics

Pod and container-level metrics focus on individual pods' performance and resource usage and their containers. These metrics are essential for understanding the behavior of your workloads and identifying potential bottlenecks or resource constraints.

Pod resource consumption

Monitoring pod resource consumption helps you track each pod's CPU, memory, and disk usage.

By monitoring these metrics, you can detect resource-hungry workloads, ensure efficient resource utilization, and prevent issues arising from resource starvation.

These metrics are available on the Kubernetes / Compute Resources / Pod dashboard.

If a pod consistently consumes more resources than its allocated limits, you may need to adjust its resource requests and limits or investigate the underlying application for potential performance issues.

Pod networking metrics

Monitoring pod networking metrics, such as network throughput, packet loss, and error rates, help you understand the network performance of your workloads. Tracking these metrics can detect network-related issues and optimize your network configuration for better application performance.

These metrics are available on the Kubernetes / Networking / Pod dashboard.

Suppose a pod experiences high packet loss or network errors. In that case, you may need to investigate the root cause, including network congestion, issues with the underlying infrastructure, or problems with the application's network configuration.

Application-specific metrics

Application-specific metrics are custom performance indicators defined by your applications. These metrics can provide insights into your workloads' business and functional aspects, helping you understand their performance from a user's perspective.

Monitoring custom application performance indicators allows you to track metrics specific to your application's functionality, such as the number of user sign-ups, completed transactions, or error rates. By focusing on these application-specific metrics, you can better understand your application's performance and identify areas that require optimization or improvement.

You can add the instrumentation code to the application code base to integrate application-specific metrics into Prometheus. Prometheus supports a wide range of client libraries.

Practical usage: Define custom metrics for your application and instrument your code to expose these metrics. Use Prometheus to collect these metrics and Grafana to visualize the data and create custom alerts.

Example: If your e-commerce application experiences a sudden drop in completed transactions, you can investigate the cause by analyzing the application-specific metrics. Potential reasons for the drop include performance bottlenecks, payment processing issues, or user interface problems.

Clean Up

To delete the EKS cluster, execute the command below in the directory where you created the cluster.yaml file.

❯ eksctl delete cluster -f cluster.yaml

How to choose Kubernetes monitoring tools

Selecting the appropriate Kubernetes monitoring tools for your clusters is crucial for effectively collecting, analyzing, and visualizing the key metrics discussed earlier. This section will discuss assessing your monitoring needs, comparing popular Kubernetes monitoring tools, and ensuring compatibility with your existing toolset.

Assess your monitoring needs

Before selecting a monitoring solution, it's essential to identify your specific monitoring requirements. Consider the following factors:

  • The size and complexity of your Kubernetes environment
  • The types of workloads running in your cluster
  • The level of granularity and detail you require for your metrics
  • Your team's familiarity with different monitoring tools
  • Budget constraints and licensing costs

By understanding your unique monitoring needs, you can make an informed decision when selecting the right tools for your Kubernetes environment.

Compare popular Kubernetes monitoring stacks

Several popular monitoring tools are available for Kubernetes, each with its own strengths. We will briefly discuss two of the most widely used tools, apart from what we have seen above Service Mesh (Istio) and the ELK Stack.

Service Mesh (Istio)

Istio is an open-source service mesh that provides a uniform way to connect, secure, control, and observe services in a Kubernetes environment. It enables advanced monitoring and tracing features, allowing you to collect metrics, logs, and traces from your microservices.

Istio integrates with tools like Prometheus for metrics collection and Jaeger or Kiali for distributed tracing, providing a comprehensive monitoring solution for Kubernetes.

ELK Stack

The ELK Stack (Elasticsearch, Logstash, and Kibana) is a popular open-source log management and analytics solution. It is beneficial for aggregating and analyzing log data from various sources, including Kubernetes components and applications. While the ELK Stack excels at log management, it can also be used for monitoring by ingesting metrics data and visualizing it using Kibana.

Conclusion

In this article, we've delved into the crucial aspects of Kubernetes monitoring, emphasizing essential monitoring best practices and providing a hands-on demo of the kube-prometheus-stack. This demonstration showcased the practical application of these concepts in real-world situations, helping you better understand their significance.

Implementing a comprehensive monitoring strategy and adhering to best practices are essential for maintaining your Kubernetes environment's optimal performance and availability. Remember that monitoring is an ongoing process, and continuous improvement is vital to stay ahead of potential issues and adapt to the changing needs of your Kubernetes environment.

We encourage you to remain inquisitive, learn from your experiences, and persistently enhance your monitoring skills to master Kubernetes monitoring effectively. By doing so, you'll be better equipped to handle the challenges of managing and scaling complex Kubernetes environments.

Comprehensive Kubernetes cost monitoring & optimization

Continue reading this series