Learn how to implement best practices for a Kubernetes logging architecture to manage and optimize log health and performance.

Kubernetes Logs: Tutorial & Best Practices

Kubernetes is a powerful container orchestration platform that enables the deployment and scaling of containerized applications. Kubernetes components generate different types of logs essential for monitoring and troubleshooting issues. Since applications scale and become more complex over time, understanding those logs and making them available for end users is crucial for managing and optimizing their health and performance.

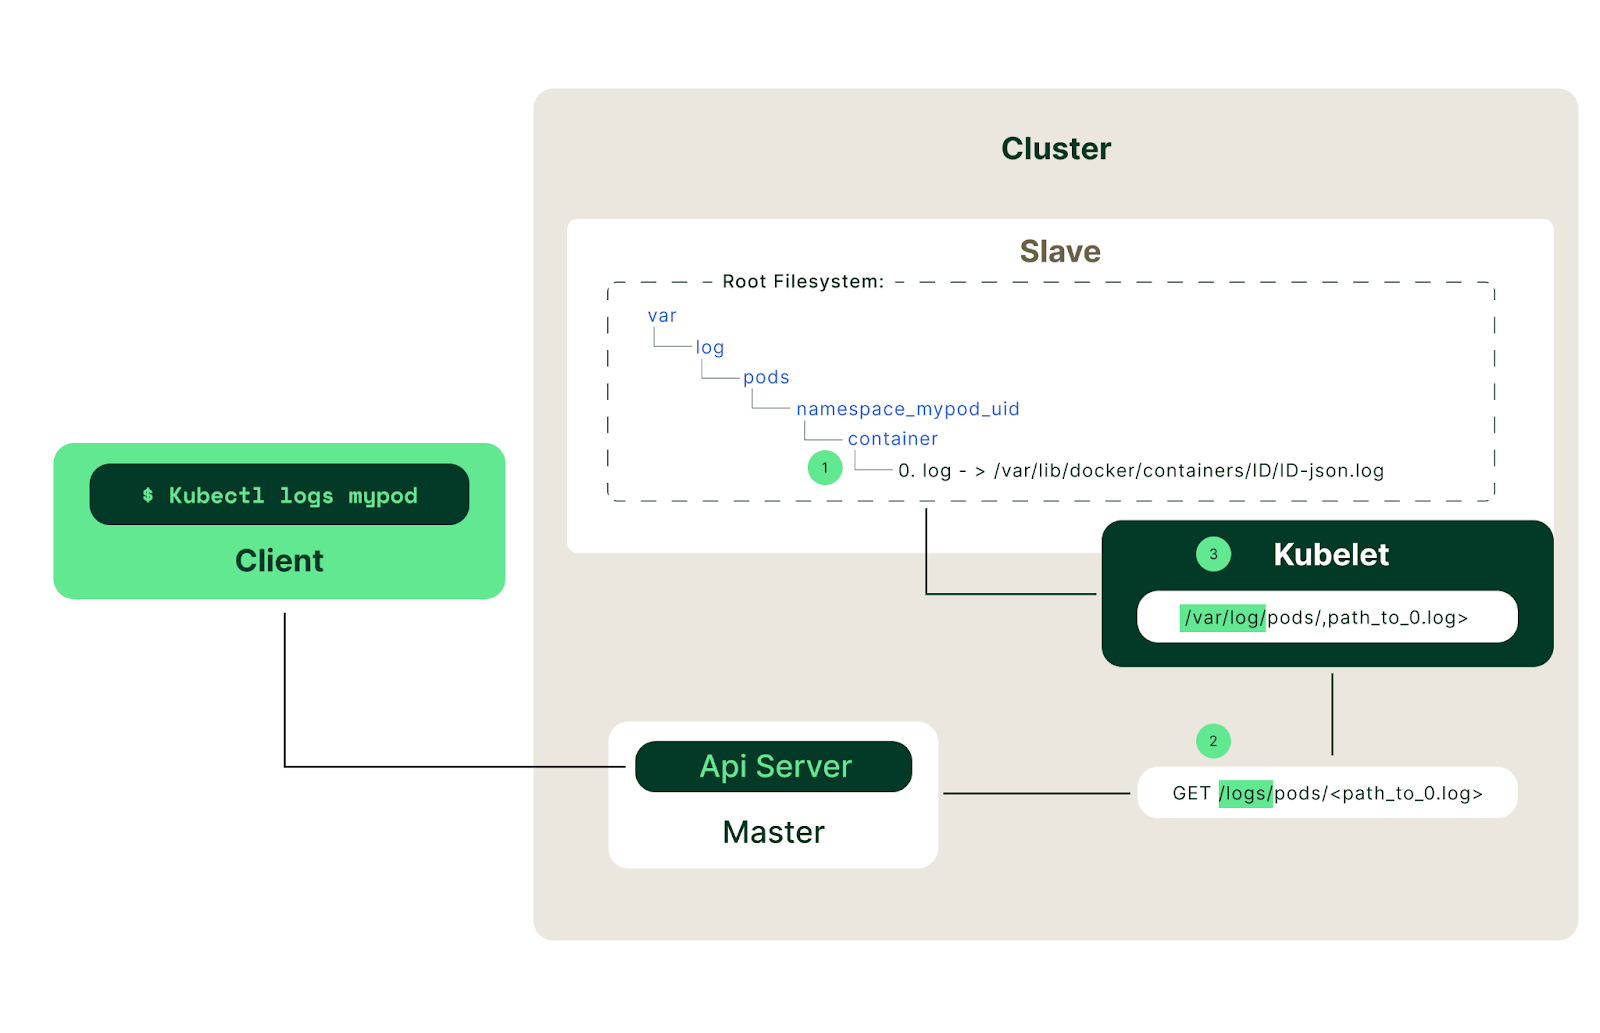
You can query any container deployed in a Kubernetes cluster using kubectl logs and native logging(i.e., stdout/stderr logs). However, if the logging architecture is not properly set up, you can encounter several challenges. For example, the logs can be gone forever if the container gets permanently evicted from the kubelet. This article discusses the recommended practices for an effective and thoughtful logging architecture in Kubernetes clusters.

Figure 1 - Illustration of how native logging works in kubernetes Source

Types of Kubernetes logs

The table below briefly outlines the different types of logs that Kubernetes collectively produces across all its layers.

Log Category Data they record
Application Logs An application’s behavior in the cluster
Event Logs CRUD operations on nodes, namespaces, and pods
Node Logs Status at the node-level i.e cpu, memory, network
Control Plane Logs Insights to health and performance of the cluster

Different log categories are relevant to separate teams that use Kubernetes. For example:

  • Application developers analyze stderr/stdout logs from the containers hosting their applications
  • Security teams analyze node logs and control plane logs to assess network security and compliance with security policies.
  • DevOps teams study event logs to manage application performance.

For all types of Kubernetes logs, there is a recommended set of best practices to optimize log management and collection for cost and usability.

Comprehensive Kubernetes cost monitoring & optimization

Summary of best practices

In the following table, we illustrate several best practices for implementing a Kubernetes logging architecture.

Best Practice Benefit
Collect all logs Ensures a comprehensive view of the cluster status
Centralized log storage Easier to collect and store logs in a single location
Log rotation Keeps logs at a manageable size and avoids disruption
Logs analysis and monitoring Increases proactivity on node, cluster, and application issues

Best practice #1 Collect all logs

A Kubernetes cluster produces logs from the control plane down to the individual applications running on containers in the nodes for the cluster. While most log capturing is automatic, developers have to configure the exact processes they want to log when they deploy an application.

Logging may be incomplete if developers:

  • Turn off logging for certain application areas
  • Configure the application to only emit error logs instead of “warning” or “info” logs could be useful in the monitoring aspect of the app.
  • Do not configure sufficient logging in the application level; or if they do, the messages that are emitted are not descriptive enough in order to provide meaningful context as to what is happening in the application

At the same time, overly detailed logging of every process can have unintended consequences. For example, the Kubernetes log level “trace” can quickly overflow the log sizes and become expensive for an organization. To avoid issues, consider customizing log configurations on a per-application basis. Additionally, pre-fixing logs with metadata makes it easier to subsequently search them, especially in organizations with large Kubernetes clusters and complex applications.

Best practice #2 Centralized log storage

A centralized logging system, such as Sumologic, Azure’s Log Analytics workspace, or Elasticsearch, allows you to store and analyze Kubernetes logs in a single location.

The added benefits of having such a system are numerous:

  • Single location access for all logs across an organization and enforcement of access control policies for different logs to various teams.
  • Regulatory requirements and policy enforcement around capturing logs made it easier for security teams.
  • Enhanced security for a comprehensive view of system activity across all Kubernetes clusters, nodes, and deployed applications.
  • Cost savings as having multiple storage solutions introduces additional line items in invoices. Sticking to one vendor helps reduce costs.
  • In addition to centralized log storage, further configuration can be created for backing up older or lower priority logs in cheaper tiers of storage, such as AWS S3/Glacier or Azure Blob Storage
K8s clusters handling 10B daily API calls use Kubecost

Example of centralized Kubernetes log storage

The starting point of shipping Kubernetes logs to a centralized log storage system is configuring a log collector and a logging driver. In the case of integration with the ELK stack, you configure the logging driver to send logs via Filebeat to Logstash, a data processing pipeline that collects, filters, and transforms logs before sending them to Elasticsearch, a distributed search and analytics engine. The steps are:

  • Configure a log collector, such as Filebeat, using the open-source helm chart. By default, Filebeat ships with ElasticSearch destination, so all you need to do at this stage is provide your ElasticSearch’s cluster details:
    output.elasticsearch:
     host: "${NODE_NAME}"
     hosts: '["https://${ELASTICSEARCH_HOSTS:elasticsearch-master:9200}"]'
     username: "${ELASTICSEARCH_USERNAME}"
     password: "${ELASTICSEARCH_PASSWORD}"
     protocol: https
     ssl.certificate_authorities: ["/usr/share/filebeat/certs/ca.crt"]
  • Alternatively, you can opt-in for changing Filebeat’s output configuration to send logs to Logstash instead. You can also deploy Logstash using the official open source Helm Chart. You can filter or apply basic transformations on specific logs before sending them to ElasticSearch. Define the IP addresses to match where Logstash has been deployed to. You may also need to specify the port number if you have a Logstash port other than the default 5044.
    output.logstash:
     hosts: [”1.2.3.4.”]
  • Configure Logstash to receive the logs from FIlebeat:
    input {
     beats {
       port => 5044
     }
    }
    
  • Finally, configure Logstash to push logs to Elasticsearch.
    output {
     elasticsearch {
       hosts => ["localhost:9200"]
       index => "var-log-%{+YYYY.MM.dd}"
     }
    }
    

Once you receive logs in Elasticsearch, you can store them in indices based on their content and metadata. You can search and analyze these indices using the Elasticsearch API or Kibana, a web-based user interface for Elasticsearch. Kibana provides various visualization tools, such as charts, graphs, and dashboards, that enable users to explore and understand logs in real time.
Learn how to manage K8s costs via the Kubecost APIs

Best practice #3 Logs rotation

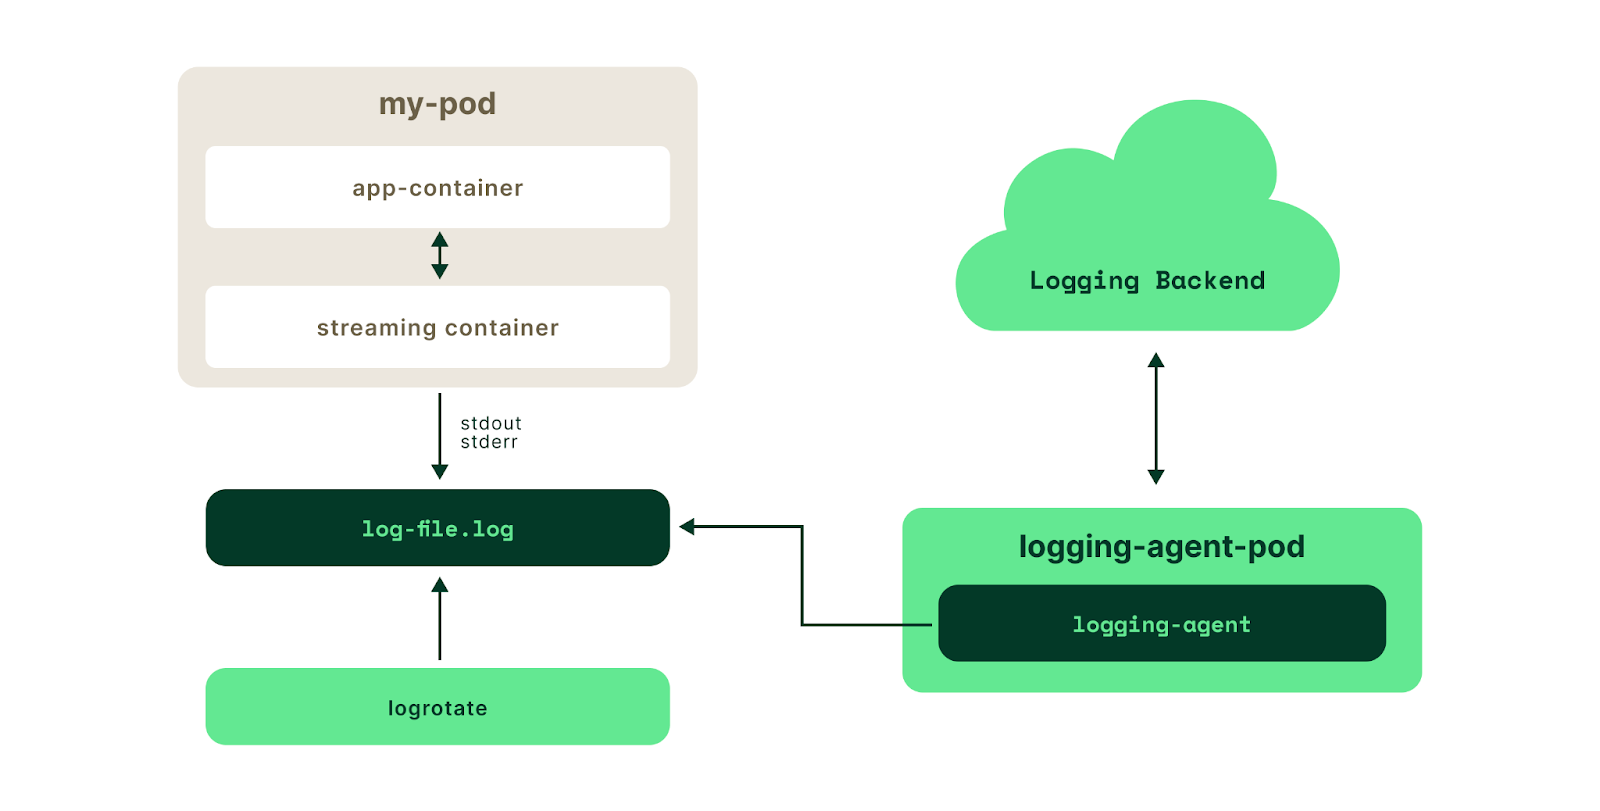
Implementing log rotation ensures that Kubernetes logs don't take up too much disk space and allows you to retain historical logs for a set period. It can be useful for troubleshooting and compliance purposes. You can achieve log rotation using the Kubernetes built-in option illustrated in the following diagram through specific kubelet configuration.

Figure 2 - Native log rotation in Kubernetes Source

Alternatively, application developers can implement custom log rotation within the application code or by using third party logging agents such as Fluentd or Logstash.

Best practice #4 Log analysis and monitoring

By monitoring and analyzing all Kubernetes logs, platform and application teams can:

  • Identify and troubleshoot issues quickly in the Kubernetes environment.
  • Use log data to identify errors, anomalies, and performance issues.
  • Take proactive measures to resolve them before they impact the system. Identify areas for improvement and optimize resources to ensure maximum efficiency.

Log analysis also helps with identifying potential security threats and preventing security breaches. You can use log data to detect unusual activity, investigate potential security incidents, demonstrate compliance, and avoid costly penalties.

Conclusion

Kubernetes logs are essential for monitoring and troubleshooting applications running in a Kubernetes cluster. You can collect and analyze logs using Kubernetes API, third-party tools, and logging agents. Structuring logs with metadata makes it easier to search and analyze them.

Best practices for managing Kubernetes logs include limiting the size of log files and rotating logs. Overall, managing logs effectively is critical for the maintenance, availability, reliability, and security of applications in a Kubernetes environment. By implementing the best practices and using the right tools, organizations gain valuable insights from their logs to improve their applications and infrastructure.

Comprehensive Kubernetes cost monitoring & optimization

Continue reading this series